Graphical Query Tool executed query

SOLVED

I have query in the Graphical Query Tool that I'd like to see the actual query executed.  How do I see the query in SQL syntax?  I want to see the tables and how / what they are joined.  Is there a way of doing that?

  • 0
    verified answer

    Hi:

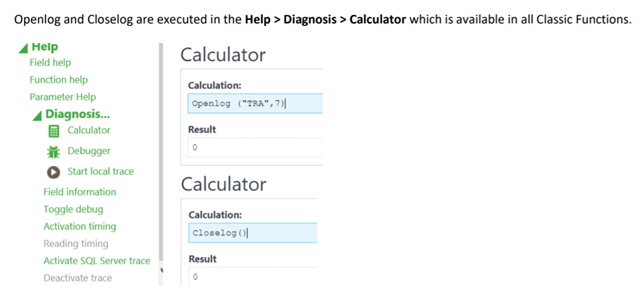
    You can use the Openlog/Closelog instructions:

    First, go to the calculator and open a log file ("OpenLog("TRA",7)"). Close the calculator and run the query. And finally close the trace ("Closelog"). It will generate a file in the “TRA” folder (something like “x3diary_admin_8980_0.tra”). In the file you will have to search for the main table that you use in the graphical query.

    And databases have their own tools, like the "SQL Server Profiler" in SQL SERVER. I haven't used ORACLE for a long time, but surely it has a similar tool.

  • 0 in reply to Nacho_Alferez

    Thank you for the reply.  I did that and was able to find the custom table called YSTK04 in the Production folder and SQL Schema.  I tried doing a trace and found the same table listed in there.  It basically does a select from the custom table but now I need to go one step deeper and find out what fills that table.  When I originally posted this, I was under the impression the query was pulling information from non-custom tables, but that isn't the case.

    Do you know how I'd find how the table is being populated?

  • 0 in reply to PSK
    SUGGESTED

    You may want to do some searches. For instance check in the table management GESATB if this table has a specific activity code and then you can search for activity codes and perhaps you'll find the screen, object.... You can search by field RECHAMZ, take a field that is unique to that table and search by that field name. If you know which object/screen populates the table then you need to look in the code of that object. You may need to do a search outside of x3 and search the source files.