
In this blog I want to talk about another built-in report that is part of SQL Server. A few blogs ago, i mentioned that Microsoft SQL Server contains some built-in reports that can help give information. For example, the Server Dashboard report, you can see details such as how long the SQL Server has been up, or the SQL Server edition running.
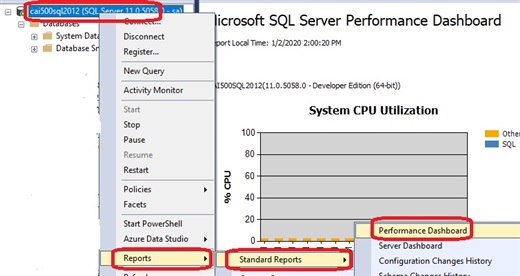
There is another report called the SQL Server Performance Dashboard that can give you a snapshot in time information in various areas in SQL Server. To access the report, login into SQL Server Management Studio and then right click on the SQL Server listed and select Reports, Standard Reports, and Performance Dashboard:
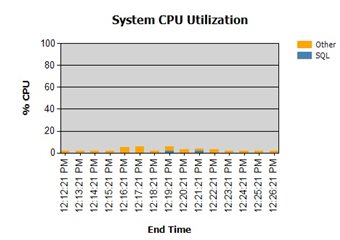
The server will gather some data and after a few moments, present you with the main report page:

The System CPU Utilization graph shows information the about the cpu utilization broken out by SQL and everything else as "Other" A 14 minute time range is sampled and displayed. You can click the Refresh icon to take another snapshot.
Under the Current Activity Section there are a couple of hypertext links you can click to drill into User Requests or User Sessions. User Requests or User Sessions will display connection information about each user including the T-SQL query that was submitted.

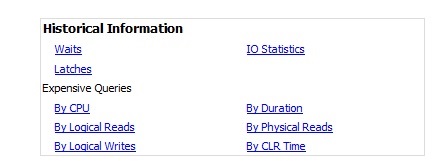
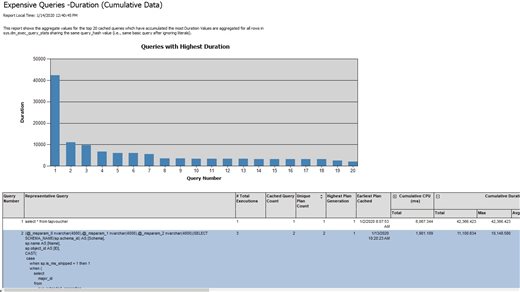
A couple of interesting things about the Historical Information section, is the Waits counter and the section for Expensive Queries. The information is accumulated over time since SQL Server has been up and running. If you were to restart SQL Server, the information from these counters would start to accumulate their respective data again. The Waits counter will show information about the SQL Server processes waiting to be processed. When you click on the Waits hypertext link, a list of different wait categories will be displayed. The Expensive Queries section shows hypertext links that will show information by CPU, Duration, or Physical Reads including the T-SQL statement involved. The example below shows a sample of Expensive Query by Duration
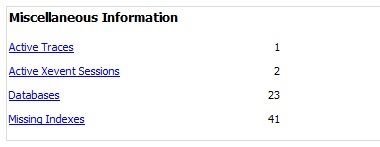
The Miscellaneous section includes a Missing Indexes hypertext link. This Missing Indexes report will show a list of indexes identified by the Query Optimizer, that could be created in order to speed up certain T-SQL queries.
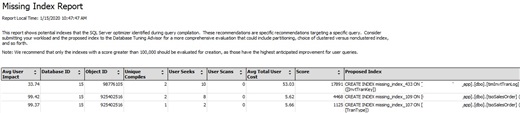
Below is a sample of the Missing Index Report that is displayed If you click on the Missing Indexes hypertext link. Very carefully consider which, if any, indexes to create. The verbiage from Microsoft states they recommend creating the indexes with a score(the column named Score in the report) greater than 100,000. The Proposed Index column of the report shows the fields and table involved for the index. I would also look at the number of User Seeks to get an idea of the number of times users have performed seeks against this table. If its a high number, and the Score value is high, it may be a good candidate for an index.
The SQL Server Performance Dashboard report can help provide moment in time statistical information about SQL Server. It is not comprehensive, however it can be a great tool to use to get quick information and uncover some potential problems on your SQL Server. If you have tried it before, take a minute and let me know your thoughts.