
Much like my previous post on SEI logs, I’ve found that Web Scheduling also provides us with several useful logs to help diagnose issues. As a newer offering, we’re constantly learning more and more about the ins and outs of how Web Scheduling works. With that in mind, note that this may not be a complete list of all the available logs—but it’s a good start! Anyways, let’s get to the logs!
XXXX.json: D:\sedApta\SupplyChain\X3_Interface\Data
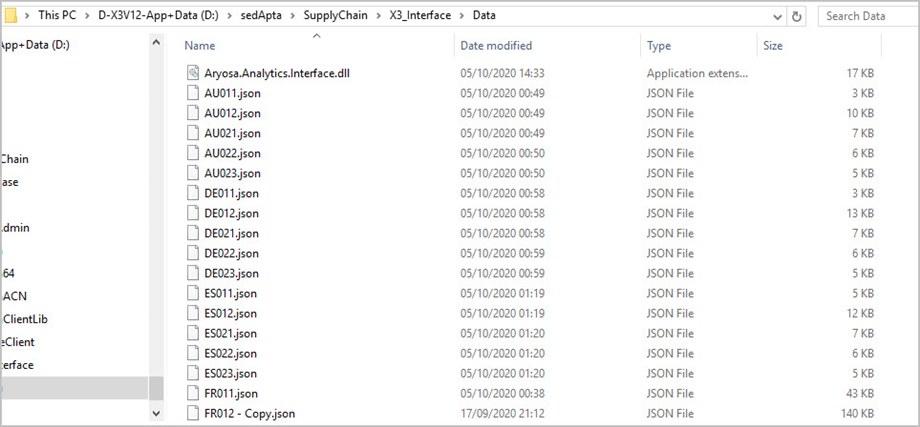
There will be one of these corresponding to each X3 site. The file is wiped clean and re-written during each import (total or partial). Here you will find the most recent records for the site that have been imported into Web Scheduling from X3.
Log_file.txt: D:\ sedApta\SupplyChain\X3_Interface\Data
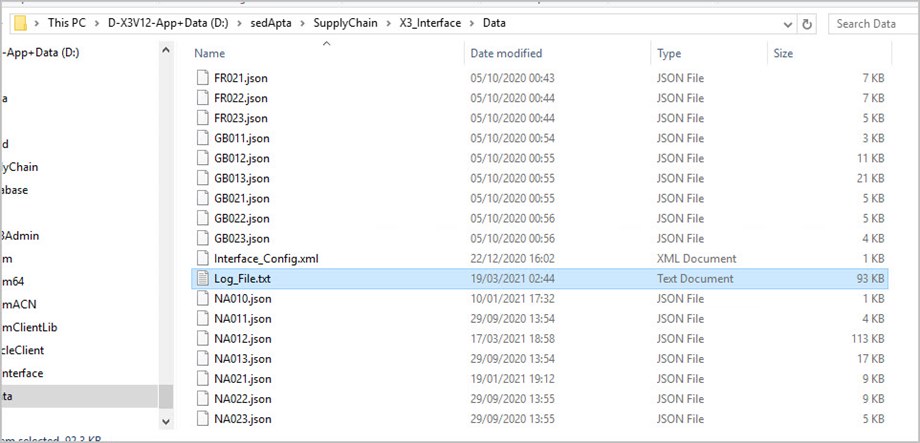

Contains the activity of the Sage_X3_Interface service (Analytics). This log shows the connection to the NICIM database, and the data insertion/SQL statements run as part of an Analytics import. The newest data is written at the bottom of the log, after each import (total or partial). If the import is successful, it will be logged as “Import Completed.” If not, you’ll find warnings and errors in this log.
Interface_Config.xml: D:\sedApta\SupplyChain\X3_Interface\Data
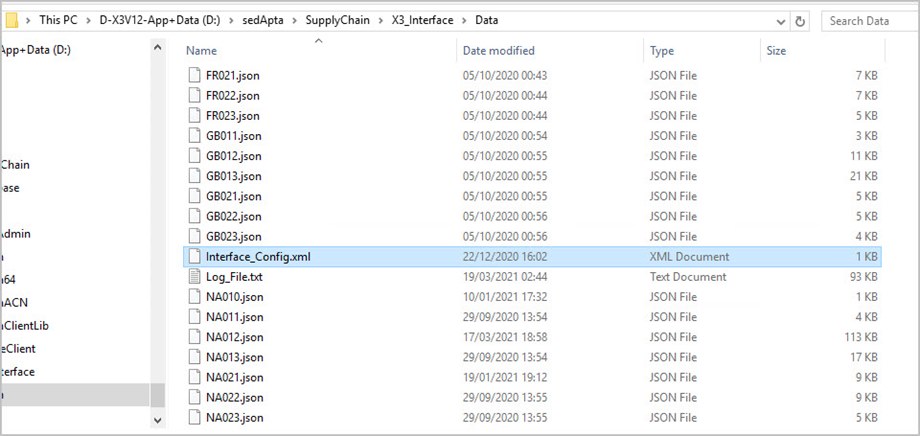
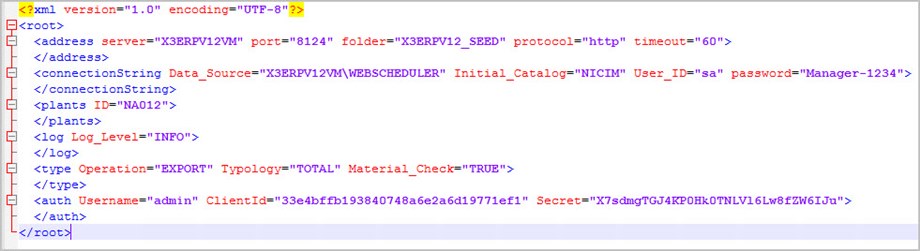
While not a log, this file can be interesting to look at when troubleshooting, since it controls the connection from X3 to the X3_Interface_Service. Of particular interest when dealing with Analytics import issues, the Log_Level can be changed to “DEBUG” to provide additional logging in the Log_File.txt. Make sure to restart the X3_Interface service after making changes to this file.
LogCallInterfaceCustomAction.txt: D:\sedApta\OSA\Analytics\AryosaAnalytics.Web\CustomActions
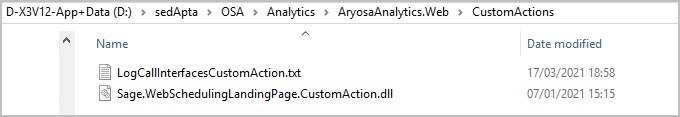
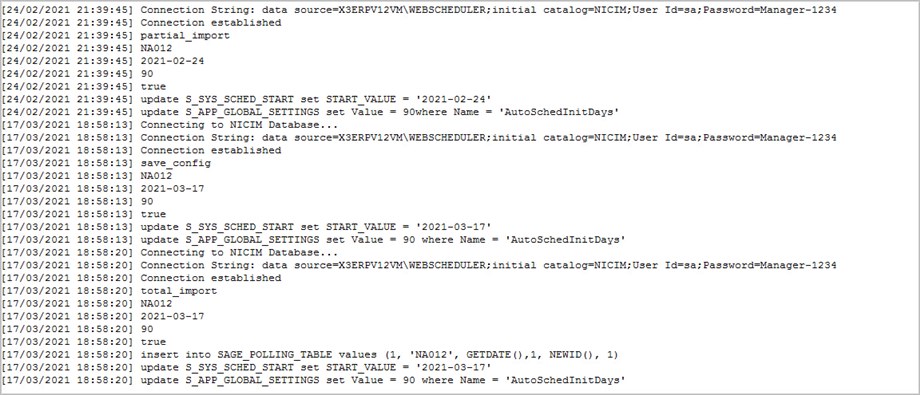
Connection and interface log that shows connection, inserts, and updates to NICIM database each time the custom interface runs. Contains dates and times of each total or partial import along with the instructions passed to the NICIM database. Parameters entered in the UI are also logged.
Logfile—yyyy—mm—dd.log: C:\ProgramData\sedApta\logs\analytics
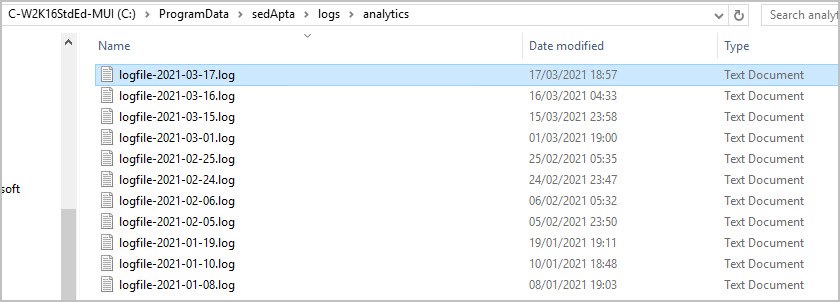

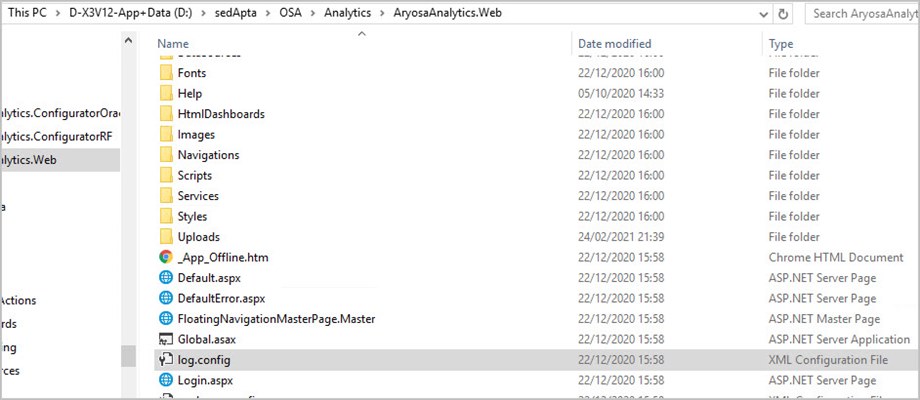
Captures connection information, and potentially detailed error logging for Analytics (partial/total imports). The logging level for this file can be controlled by the log.config located in D:\sedApta\OSA\Analytics\AryosaAnalytics.Web.
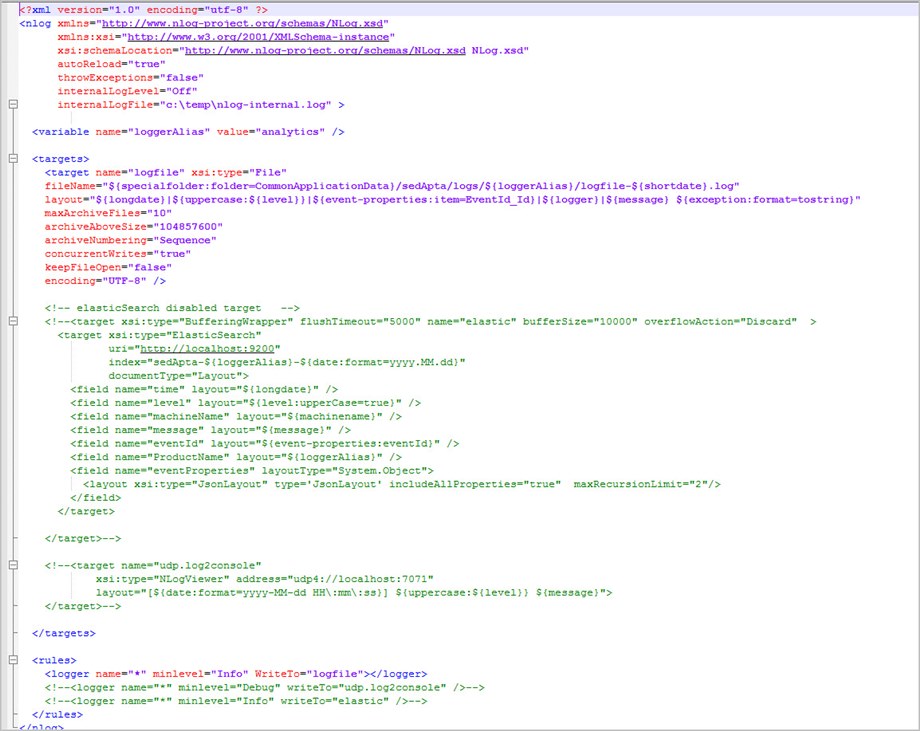
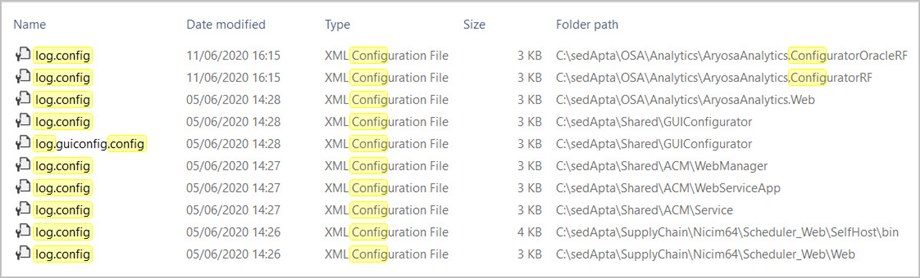
Bonus—there are several other logs available in C:\ProgramData\sedApta\ that you might be able to get useful information from. Each of these logs is controlled by a log.config like the example above—while in your sedApta installation directory (D:\sedApta\ on my test machine), just search for log.config to see all the possible options. Maybe I will do a deeper dive into each of these in a future blog post.

As always, if you find yourself in a situation where reviewing any of the above logs doesn’t help you resolve the issue you’re faced with, reach out to your friendly local support team. Until next time!