
Last week, I introduced a partner to two troubleshooting tools that he had never used before. One helped him resolve an issue that had him stumped. After the issue was resolved, he mentioned how he wished he had known about these tools sooner. I immediately thought “Blog!” This would be a great opportunity to introduce or reacquaint others with a few troubleshooting tools of the trade that are available for Sage X3.
Engine Trace
An engine trace triggers the log mode for the X3 engine. Check out the “Engine Trace” entry in the Online help center. You can run the trace for the entire session, for just a function or run from within your code. Refer to:
Knowledgebase article 81615: “How do I run an engine trace from within a function?”
Knowledgebase article 73801: “How to run an Engine trace in Sage X3?”
Knowledgebase article 83553: “How do I initiate an engine trace from within my code?”
What would you use this for? As an example, you can follow what code is being called and from what directory, see what SQL calls are made, or compare the code flow from a folder that is executing successfully to one that isn’t. Even if you can’t interpret the data yourself, you can have it ready for your partner or support to help speed the troubleshooting process.
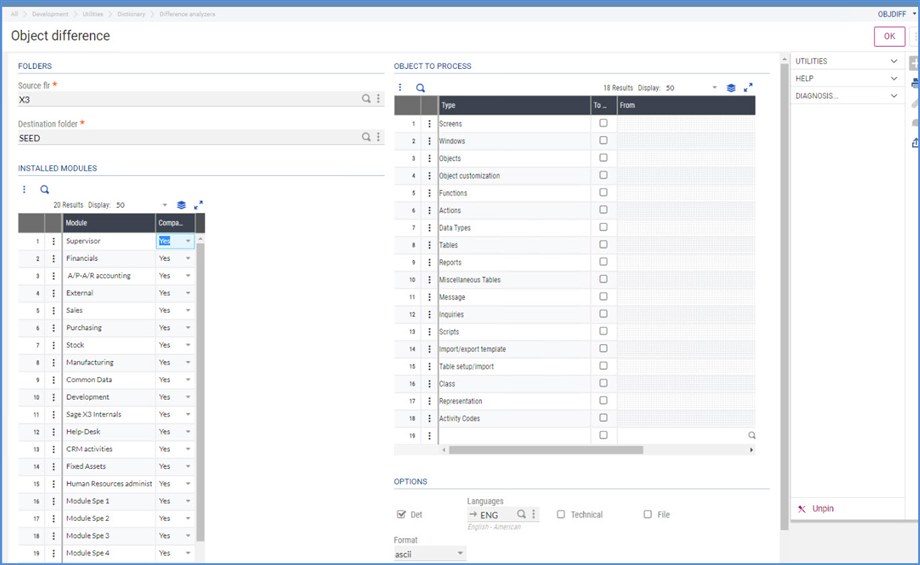
Difference Analyzer: Object
The Object difference analyzer is found under Development, Utilities, Dictionary, Difference Analyzers (ACOMPOBJ). Per the Online help: “This function is used to globally compare dictionary elements between two folders. The result is given in the form of a log file which level of detail depends on the execution options selected.” Refer to:
Knowledgebase article 96586: “How to use the Difference Analyzer (for objects)”
Sage City Blog: “How to determine if there are any customization in my installation?”
What would you use this for? It is perfect for highlighting differences between a customized folder and the X3 reference folder. These differences could potentially be behind errors or unexpected results. Keep in mind that the X3 reference folder is the gold standard and should never be modified which is why it makes a good basis for comparison. The analyzer tool could be used to keep track of differences between the development and production folders.
ALOGSUP
ALOGSUP is used to gather information such as Database server settings, Activity code settings parameter values, etc.
Knowledgebase article : “How to send diagnostic information to Support (ALOGSUP)”
Sage City Blog: “Sage X3 Support- ALOGSUP: Diagnostic Info For Sage ERP X3”
Why would you use it? If you’ve gone through the troubleshooting process, you will probably have been asked for this information. This is an easy one-step way to provide it. Also, you can save this data off now and if issues arise later, run ALOGSUP again to determine what has changed. You can use this to compare before and after migration data.
GTEST
GTEST throws the system into a debug mode and allows the display of the journal entry lines before the journal is created. In Sage X3, journal entries are either successfully generated or the system rolls back the transactions. You don’t have the opportunity to review what the journal would have been. Refer to:
Knowledgebase article 16796: “How to use the GTEST command for diagnosing out of balance situations in accounting”
Why would you use this? The error log for an out of balance journal doesn’t provide information as to what line is missing, what rounding has gone wrong, etc. This debug mode allows you to see the detail lines for an out of balance journal so you can troubleshoot why the journal won’t generate. Was it an incomplete Accounting code setup or a custom auto journal gone bad? The GTEST will help you track down your problem.
Performance issues
I couldn’t write about troubleshooting tools without mentioning knowledgebase article 76348: “How to troubleshoot slow performance for Sage X3.” This article provides links to helpful blogs, articles and tools.
Why would you use it? When you have slower than expected performance, this article is a great reference for what information to gather or review.
Don’t forget…
The Online help center has a wealth of information to start your troubleshooting. It contains how-to guides, tutorials, data modules, error explanations and more. It is a frequently overlooked troubleshooting asset.
The knowledgebase (https://support.na.sage.com) articles may specifically contain the resolution to your specific error message or steps to successfully complete a process.
Before we finish…
You might find this section redundant, however, these items can’t be stressed enough.
Make sure that you are backing up regularly and that the backup is usable. You want to be prepared to quickly and efficiently restore in the event of a catastrophic loss of data.
Have a test environment with current data where you can run “what if” scenarios and train newbies. If your issue is replicable on the test system, you can troubleshoot away, entering transactions, closing periods etc. to track down the root cause of the issue without danger of interfering with the production system.
If you don’t have a change log, please start one. Change a parameter, record it. Customize an auto journal, document it. Then, when the person troubleshooting your issue asks, “what has changed?” you’ll be prepared. It is also great aide at upgrade time, so you know what changes to review and carry forward.
