

Trying to troubleshoot Production Scheduler and can't make heads or tails of the log file? Seeing warnings throughout the logs but everything seems to be working? How do you know what those log files mean? Well, read on…
The logs in Production Scheduler can be difficult to understand but hopefully you will have a better understanding after reading this blog. First, let's talk about where to find the log files. The easiest place to fine the log files is in PlannerOne. Open PlannerOne on the server and go to the Logging tab. Choose PlannerOneApplication.log for the Log File and click on Open / Refresh log. You will find the newest information at the bottom. If you want to follow what is going on in real time, check the Auto refresh and Follow tail checkboxes. This will - surprise, surprise - auto refresh the log and it will keep you at the bottom of the log to see the newest info coming in. Just one weird note, if you try to copy text or scroll up, you will have issues. You need to uncheck the auto-refresh to do that. If you need to get a copy of the log files to send to support, click on the export button next to Open / Refresh log.

One more thing before we start looking at the logs. Production Scheduler logs can be put in debug mode to give you more information. To do so, you need to use PowerShell. If you are unfamiliar with PowerShell, you might want to consider working with someone who is.
Changing the log level
- Open PowerShell as administrator
- Change to the Production Scheduler PowerShell directory (usually C:\Sage\Planner_one_for_Sage_X3\SAGE.6.0.XXXX\module, where XXXX is the version number)
- Run the init.ps1 script (type ./init.ps1). You should see something like this:

- Check the current level of logging: get-p1loglevel -tenant XXXX (where XXXX is the name of your tenant e.g. SEED)
- Change the level of logging: set-p1loglevel -tenant XXXX -level DEBUG
- Don't forget to change the level back to INFO when you are done troubleshooting. DEBUG will make your log file large
Ok, let's get into the log files.
If you only want to see errors, look on the Error list tab in PlannerOne.

If you click on the error and then click on more information, guess what you will see? That's right! More information about the error.
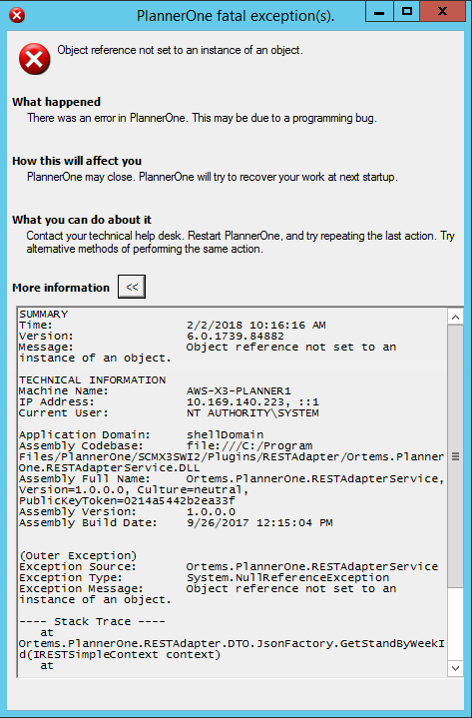
Now, the information you see in this particular error doesn't really tell you much. So we need to look at the log files. First, note the time and date of this error. It will help you find it in the log file.

We start with the time of the error from the Error list tab and work up from there to find the actual problem. In this case, the actual error is the unexpected property mess/sev in environment. This is what you will see when Production Scheduler doesn't understand the information it is getting. The next obvious question is, what didn't Production Scheduler understand? Well, we need to use a different program to figure that out. We use Postman which is a free download on the internet. I'll go over that in a moment.
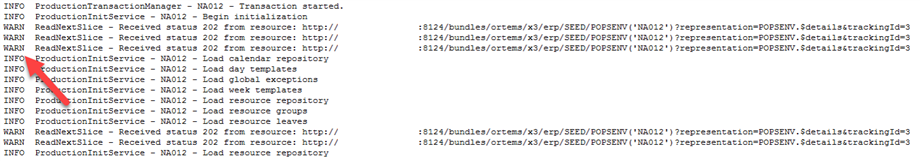
Let's take a quick look at something you've probably seen in all the Production Scheduler log files you've looked at, WARN ReadNextSlice. This is not an error. It's not really a warning either. All this is telling you is that it is still loading information into the system. It's reading the next slice of data. You need to look for what happens after this warning if you think it is related to an error.
Using Postman to troubleshoot Production Scheduler
Once you download and install Postman on the server, you need setup access. Change to the Authorization tab and click on the drop down under Type. Choose Basic Auth.
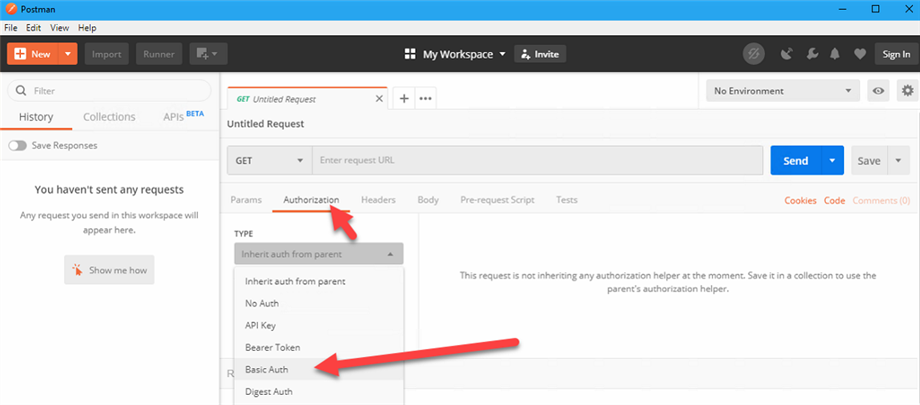
You will need to enter a username and password that can log into X3. Now we can get to finding more information about our errors.
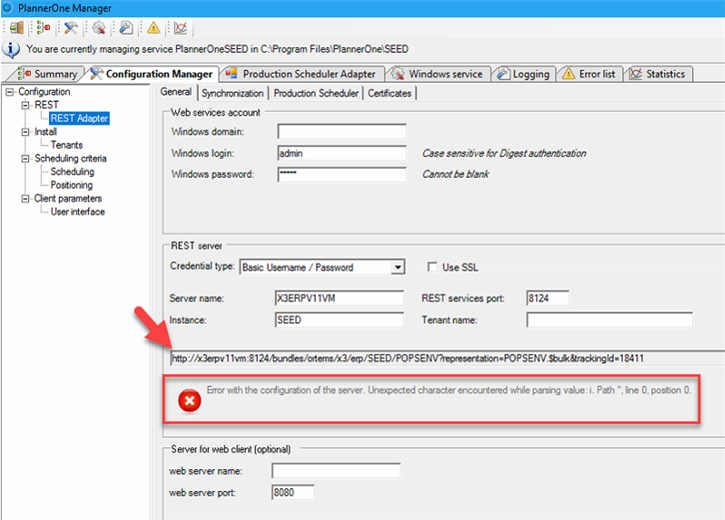
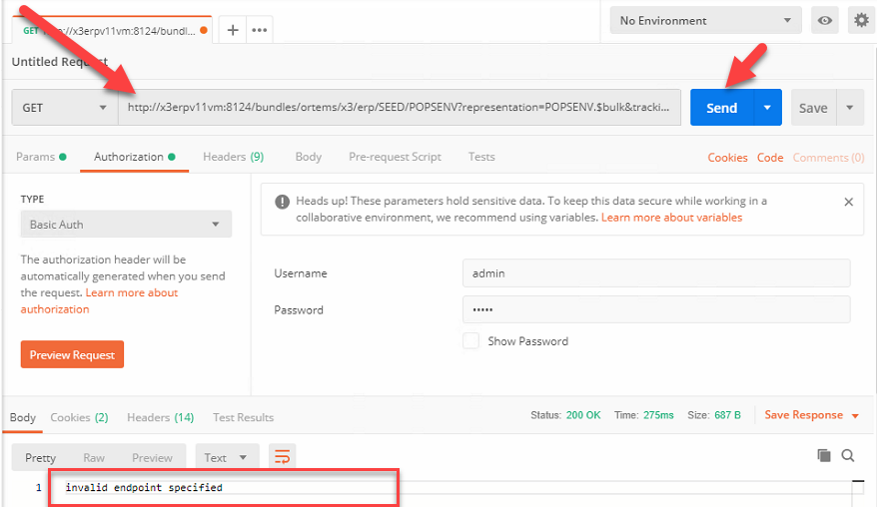
Let's look at an error. I have a red X in PlannerOne. The message says Unexpected character encountered while parsing value. Huh? Well, let's find out. I can take the URL in the box above the error message and plug it into Postman.
I put the URL in the box at the top next to GET and hit Send. At the bottom of the screen you should see more information about the error.
So let's look at our example from above.

We saw the message unexpected property mess/sev in environment. If you look just a bit above that message, you will see the ReadNextSlice message. That is what was trying to process when we got the error. So, if we copy the URL that is in that line and plug it into Postman, let's see what it tells us about this error.
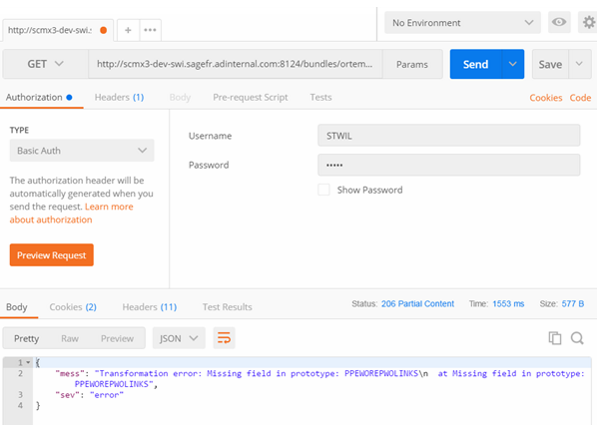
The message tells us that there is a missing field in prototype, it's a transformation error. This usually means there is a mapping problem.
So if you are trying to figure out what it going on with Production Scheduler, find the error in the log file and see if there is a URL referenced in or near the error. If so, plug that into Postman and see what it tells you. And of course, check the knowledgebase or contact support for more help.
