

Updated: 19 August 2022
Please note this document and all other documents it links to are living documents so will evolve over time as new things are discovered, new functionality is provided, best practises adjusted and/or when I get time to add content; so please make sure you come back and visit this source document often.
Contents
Performance tuning your Sage X3 system: Syracuse
General blogs, KB articles, etc.
Introduction
Syracuse is the web presentation server that users and interfaces such as SOAP and REST requests access in order to interact with Sage X3.
You will use the online help and architecture guides listed in the references below to determine if you need to configure a Syracuse cluster (Multiple servers) and/or how many child processes and web service processes need to be configured on each server. Making sure you have the correct number of child processes for your load is the first key task for best performance!
The Syracuse logging blog article discusses the Syracuse architecture and how to configure Syracuse logging, so is worth a read through (also listed in the references below)
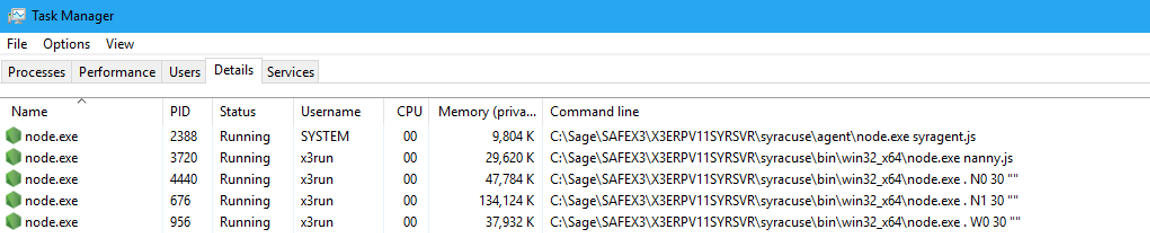
Syracuse child processes
All user requests and inbound REST requests are serviced by the Child processes (“N” node.exe processes) and all inbound SOAP requests are serviced by the Web service child processes (“W” node.exe)
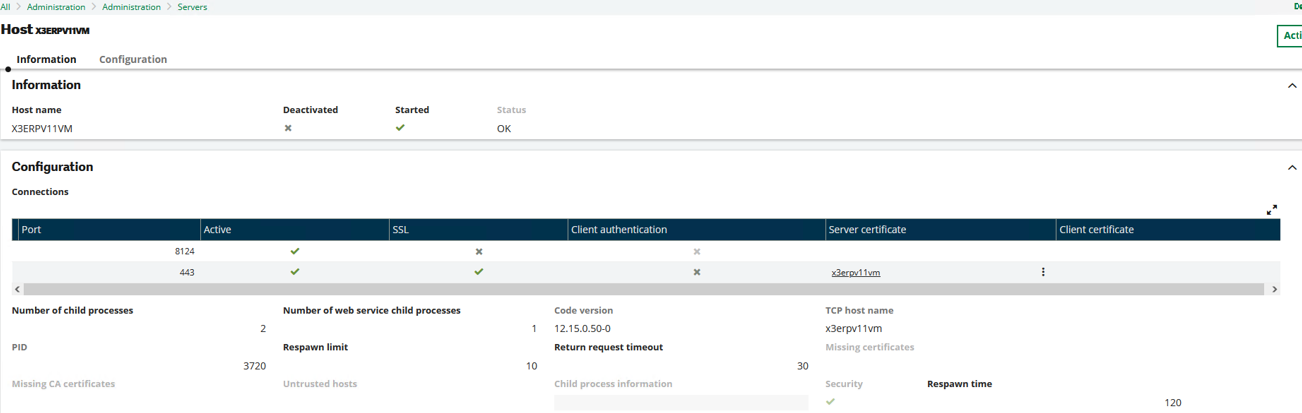
The “Return request timeout” is the amount of time given for a web request to return back the response to the client. In most cases the default of 30 seconds is fine, however Web Service calls in particular can sometimes take longer than 30 seconds to return back which can result in odd behaviour or a timeout. In this situation, increasing the “Return request timeout” can be useful to resolve this kind of issue.
With the above configuration I have two “N” processes (N0 and N1) plus one “W” process (W0) which I can see in Windows task Manager. NOTE: although you must define 1 Web Service child process during installation, if you don’t use Web Services you can disable after installation.
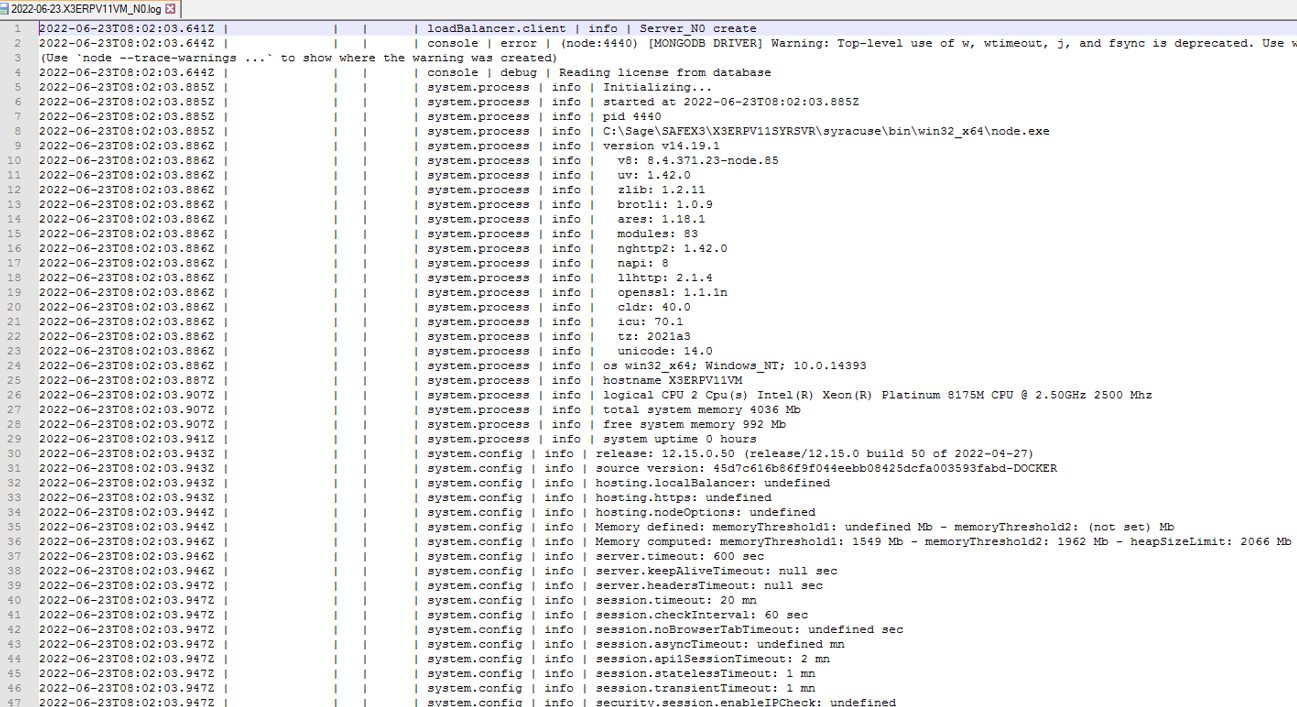
Each child process will pick up the default configuration for memory allocated, etc. These settings are defined in the nodelocal.js file located in “..\syracuse\bin” directory. To see the effective values, you can set the logging (via “Global Settings”) to echo these settings into the log files located in “..\syracuse\logs” (by default)
Architecture
As per the Architecture Guide, if a significant part of your transactions come through SOAP Web Services, you should dedicate one or more Syracuse nodes to service only Web Service calls. Interactive sessions would therefore be dedicated to different Syracuse nodes.
Syracuse memory
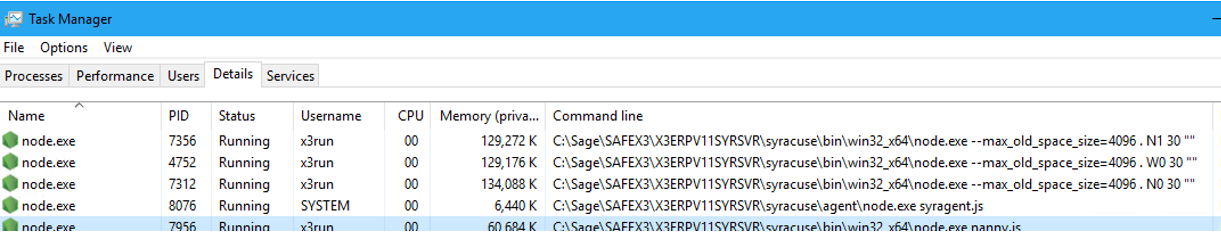
From this log file extract we can see the memory threshold value. The default value often needs changing, in which case you can review the NodeJS sizing recommendations in the online help. If the memory needs changing, I would normally just use the “nodeOptions” value which is automatically translated to the appropriate memoryThreshold values. So if I update nodelocal.js with the following:
![]()
When Syracuse is restarted I see the nodeOptions added to the command line and also see the effect in the log file:

How do you know the memory needs resizing?
You may be seeing the node.exe processes spinning at 100% CPU with not much apparent activity. You can also enable logging to see the memory consumption information echoed into the log file every 5 minutes.

How many child processes do I need?
This is covered in detail in the online help and architecture guide.
How to identify long running requests?
Review the Syracuse logging blog for more details about Syracuse logging. These logs will often be key evidence to start a performance investigation. If you add the “http.in” logging to “info” level then you see the amount of time taken to process the requests through Syracuse.
In the example below, I run a classic function “ZSLEEP” that takes 3 minutes to complete. The classic session for the request is initiated in id=492, then the parameters entered by the user in id=495 (you can see this one takes 4 seconds to complete, although this is not to do with the user time just how long it takes to process the request in X3) X3 classic client then polls the adonix process to see when it finishes, which you see as “202” status requests from id=495 through to id=537. When the process has finished in id=538 the status becomes “200” as the request has completed and the screen is returned to the user with the results. Each 202 “ping” should be a few milliseconds. During this time, Adonix.exe will be processing whatever it needs to do to return the result, in this case taking 3 minutes to finish.
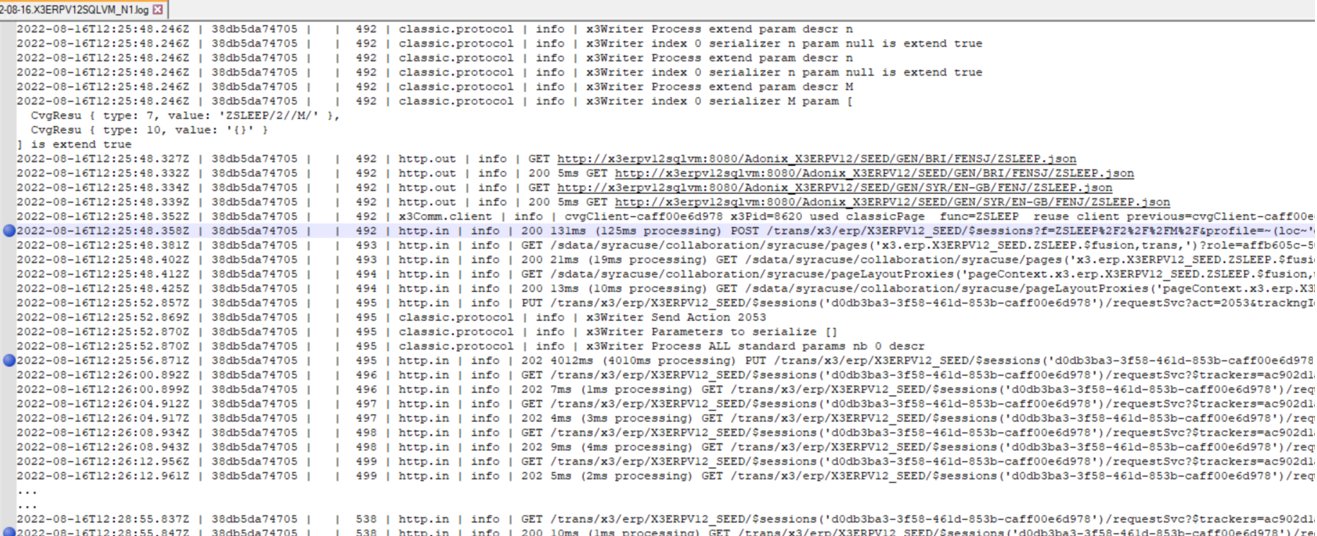
Each id number in this log output is a request and response pair. They may not always be next to each other, depending on load on the system and how long it takes, etc.
Web services
See the “X3 considerations” article for discussions about Web Services. (Coming soon)
General blogs, KB articles, etc.
- js web server recommendations (Online help)
- Configuration file nodelocal (Online help)
- Memory and CPU considerations for Syracuse (Architecture Guide)
- Syracuse Logging (Blog)
- How to increasing logging levels for diagnosing issues (Blog)
- Should I change the default Syracuse logging in my production system (Blog)