When troubleshooting various issues, whether it’s related to performance or errors associated to individual users, knowing their Process_ID can help navigate the large amounts of information generated from SQL traces.
First step is to identify the users Process ID or SADOSS ID.
Identify the user with the issue and note the User ID they used to log into Sage.
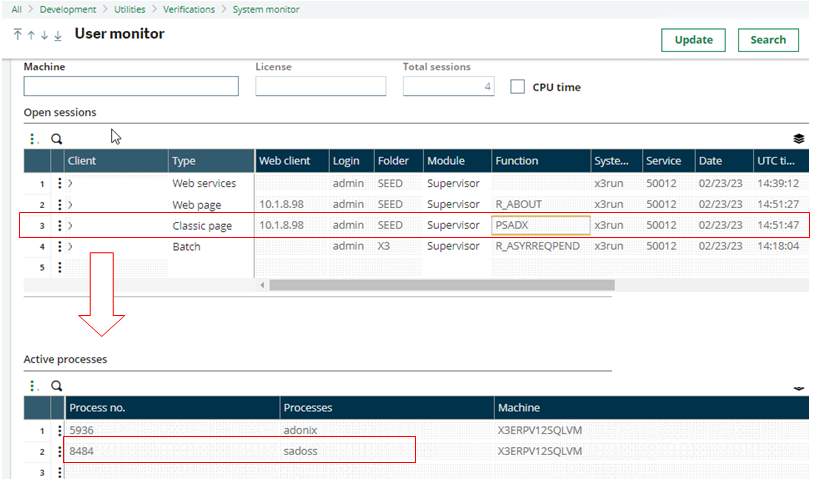
- Open Development, Utilities, System monitor, Users (PSADX)
- Locate and select the row of the user whose actions you want to profile trace.
- In the Active Processes pane, locate the row with sadoss in the “Processes” column.
- Note the Process no. (8484 in this example)
That was simple….
Now let’s put that to use….
Using Process_ID with SQL trace:
To learn how to setup the SQL profiler you should have a look at this Blog post:
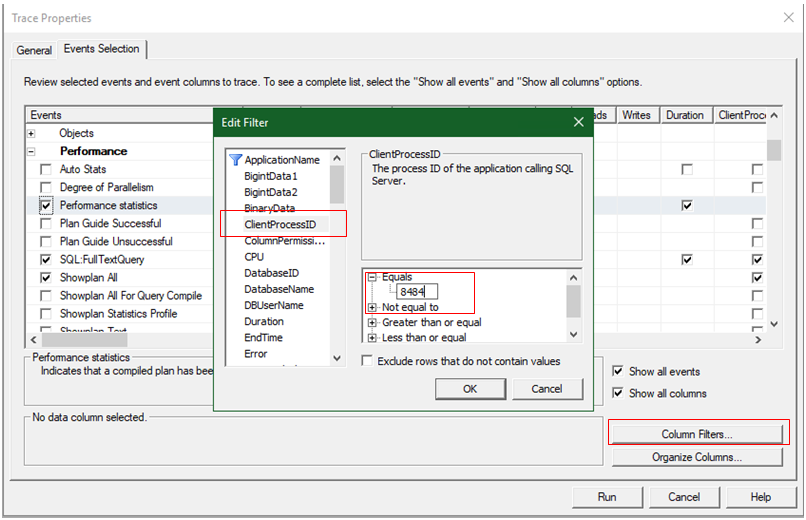
Once you’ve added the specific events to trace add the following filter:
- Click Column Filters..
- Under ApplicationName select “ClientProcessID”
- Expand the Equals option and type in the Process_ID you gathered.
- Click OK
Note: Be sure to have X3 one step away from replicating the problem or issue so that it limits the amount of detail in the profile trace.
Click “RUN” to start the trace and re-create the issues in the front end application.
Once you’ve re-created the issue swtich back and stop/pause the trace.
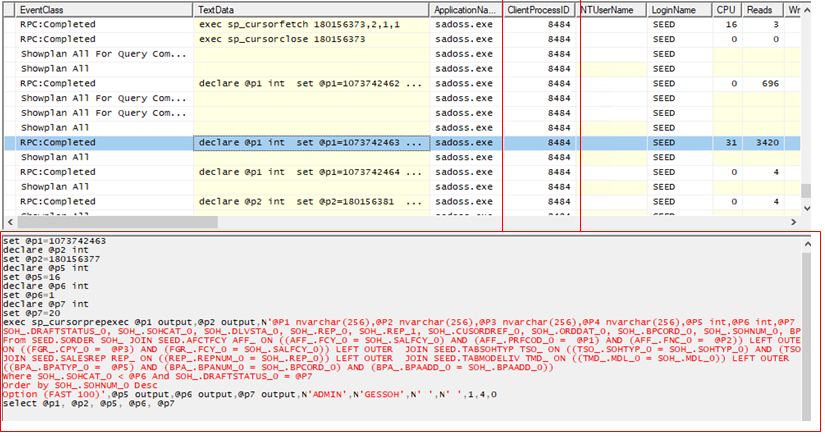
You should see results similar to below, you will notice the results are limited to entries specific to the user we filtered on.