Slow Performance during Report Phase Job Started and Printing X3 V12

Hi, my company is in the middle of a migration from SAGE X3V5 to SAGE X3V12. R093.001.00019

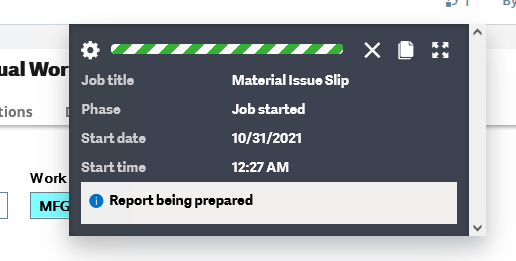
When running a report in X3V12, the querying part (Job Started Phase with the green bars) takes an extra 1-3 minutes on average than it did in X3V5. In X3V5, simple labels and object related reports like sales orders and invoices used to take seconds to Preview or Direct print. Once it hits the Print Spool itself, prints right away, but can take 2-3 minutes to show up. This is really impacting direct print jobs for our warehouse operations as well as document print/preview jobs for backroom operations. All report types are effected either standard and custom ones. Any help in locating the source of the issue is much appreciated.  Attached screen shot.

  • 0

    We just upgraded to X3V12 and have the same issue. Invoices used to take 10-14 seconds, now take 50-60 seconds. Anyone solved this?

  • 0

    Hi, and ,

    Have you tried to extract the SQL Query sent by Crystal Report ? Might require some different indexing. Plus, SQL Server Query Optimizer has changed the Cardinality Estimator from 2014 version, and the speed of queries if you leave it like this will be slower with the new C.E. but with a better efficiency like on memory mainly.

  • 0 in reply to Bruno Gonzalez

    Hi Bruno,

    This impacts all queries sent from simple itmmaster lookups to multi table Invoice reports. The ITMMAMSTER ITMREF field already has an unique index. I do not believe it is a SQL issue, but a Crystal Report rendering issue. 

  • 0 in reply to Byron Norment

    Hi Byron,
    We don't have that on all customers for all reports, so I do not believe it is Crystal Report related, but I might be wrong. I would ask support if there is a preferred Report server version for your case.

    To give you a precise example, I had a V6 report running in 30 seconds but in V12 it took 30 minutes.
    Report did change a little bit, but when I investigated, it was the Query - which was the same between V6 et V12 report - that made the difference. Run the query in legacy CE -> 30 sec, run it with new CE -> 30 min.
    You can easily see where the time has been spent if you put your report server in debug mode.