
Perhaps a user has determined an action that they believe is slow or can perform better. Perhaps you are writing a custom program and want to know where time is spent so that you can better tune your modification.
One of the first places to start is with a timing trace. The timing trace will be able to tell you how many calls were made to that piece of code and how much time was spent within that code.
There are several methods to activate/deactivate/read a timing trace. The context can be important because functions are not all the same.
Method 1: Timing a user action
For example, you have identified that it is slow moving from the product column while entering a sales order.
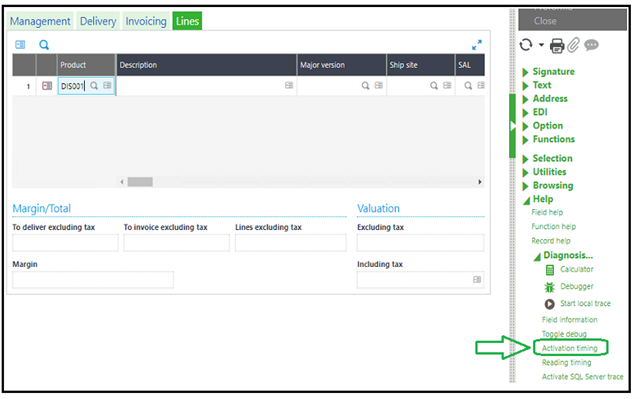
- Get to the point where you have identified it as slow. In this case, to the product column prior to tabbing off.
- From the right menu, expand Help, Diagnosis.
- Select Activation timing
- Take note of the Log file location and change the file path and file name as desired. Note: if necessary, Sage support will ask for this file.
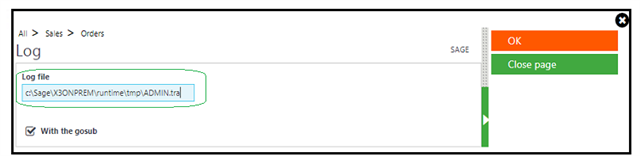
- Click Ok
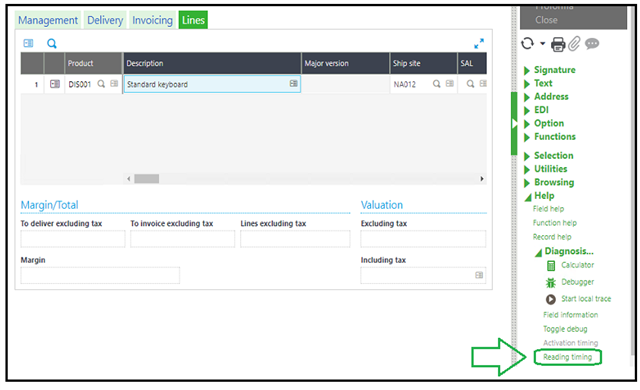
- Complete your user task
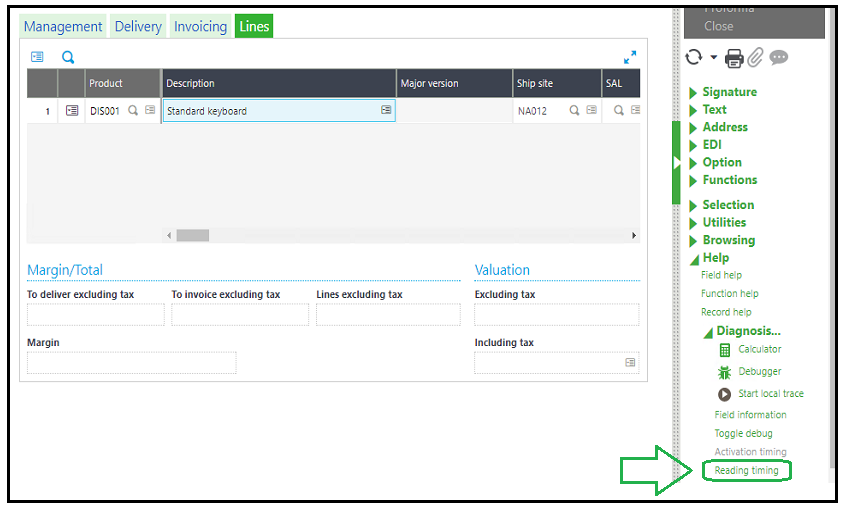
- From the right menu, select Reading timing
- You will be presented with a log

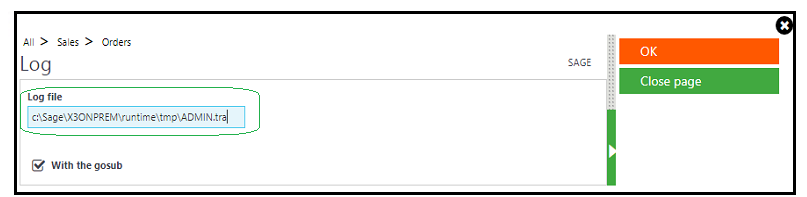

Result: In this case, we can see that ZSLEEP was called from the SPESOH program one time and spent 3001ms of the total 3049ms traced (98.42%) and we could reasonably assume that our issue lies in this code.
Important: If a user does not see Activation timing as an option, it is likely they have not been given security access. The user (Setup, Users, Users) on the Parameter definition tab will need to have DBG=Yes in the SUP chapter and DEV group.
Method 2: Timing within 4GL classic code (KB ID 79316)
This could be useful in testing your specific code, a subset of a larger program, or within the batch server
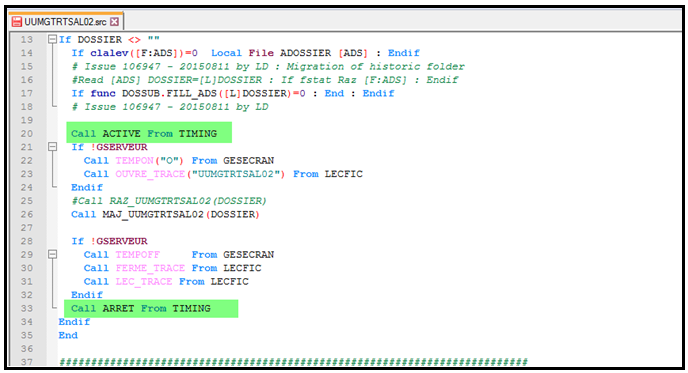
- If you just want to test your code, you can insert in your source the following statements :
# Activate the timing trace
Call ACTIVE From TIMING
# Your code
...
#Stop and read the timing trace
Call ARRET from TIMING
- If your code needs to be executed on the BATCH server or through a web service:
# The following statement start the timing trace and log in an intermediate file generated in the runtime tmp directory
# The name of the file is the name of the user used to execute the program
# The second parameter of the function (2) indicates the log of the gosub, replace with 1 if you don't want gosub
Call ACTIVE_MAN(filpath("!tmp",GUSER,"tra","","",""),2) From TIMING
# Your code
...
#Stop the timing trace
#The runtime stop to trace and close the file located in the runtime tmp directory
Call ARRET_MAN From TIMING
This method does not automatically display a log. If you want to analyze the file generated you can use this code :
Call LECTURE(filpath("!tmp",GUSER,"tra","","",""),2) From TIMING

Note: Remember to use the same user (or specify the right user instead of GUSER).
Result: We will generate a log similar to that displayed in the first method.
Method 3: Timing with V7 style code (Online help topic: "Profiling code")
Starting the profile process
This is performed by using the function ASYRTIMING.START. This function includes two parameters:
-
A string character value that defines the temporary file name without an extension and path, where the calls and timestamps are written. If an empty value is given, the name will be generated by using the following method:
- Get the user code in lower case.
- Get a unique ID linked to the process by using
adxuid(1). - Build a path in the "tmp" sub-directory from current Sage X3 solution, and create a file called with the two previous segments separated by an underscore, and with a ".tra" extension.
-
An additional integer is set to '0' by default. Its value will be modified to '1' if the code called by
Gosubneeds to be analyzed.
Ending the profile process
This is performed by using the function ASYRTIMING.STOP. Four parameter must be filled:
- A pointer on the current context.
- The temporary file name where the calls and timestamps have been written. If the file name is not provided, the same algorithm will be used to generate it.
- The same integer value to know if Gosub must be analyzed.
- A string variable that returns the generated detailed log file.
Example:
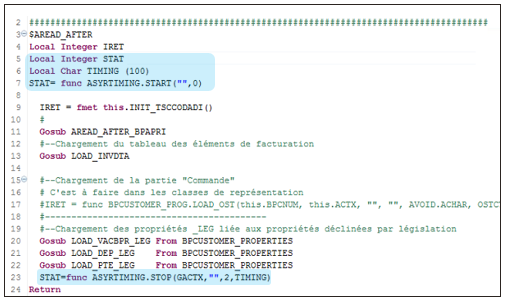
As mentioned above, if no path is entered, the file will be generated in the tmp directory of the runtime. You will need to use the same method as previously mentioned to analyze the data.

Result:

Profiling the Sage X3 script code is important to obtain the best possible performance. It localizes time consuming programs and measures how often certain code sections are called.