

Introduction
The new Sage 300 Home Page provides a nice launching point for running your new Web based Sage 300 Accounting screens. It also provides a Home view where you can choose to display up to six KPIs out of a palette of twelve.
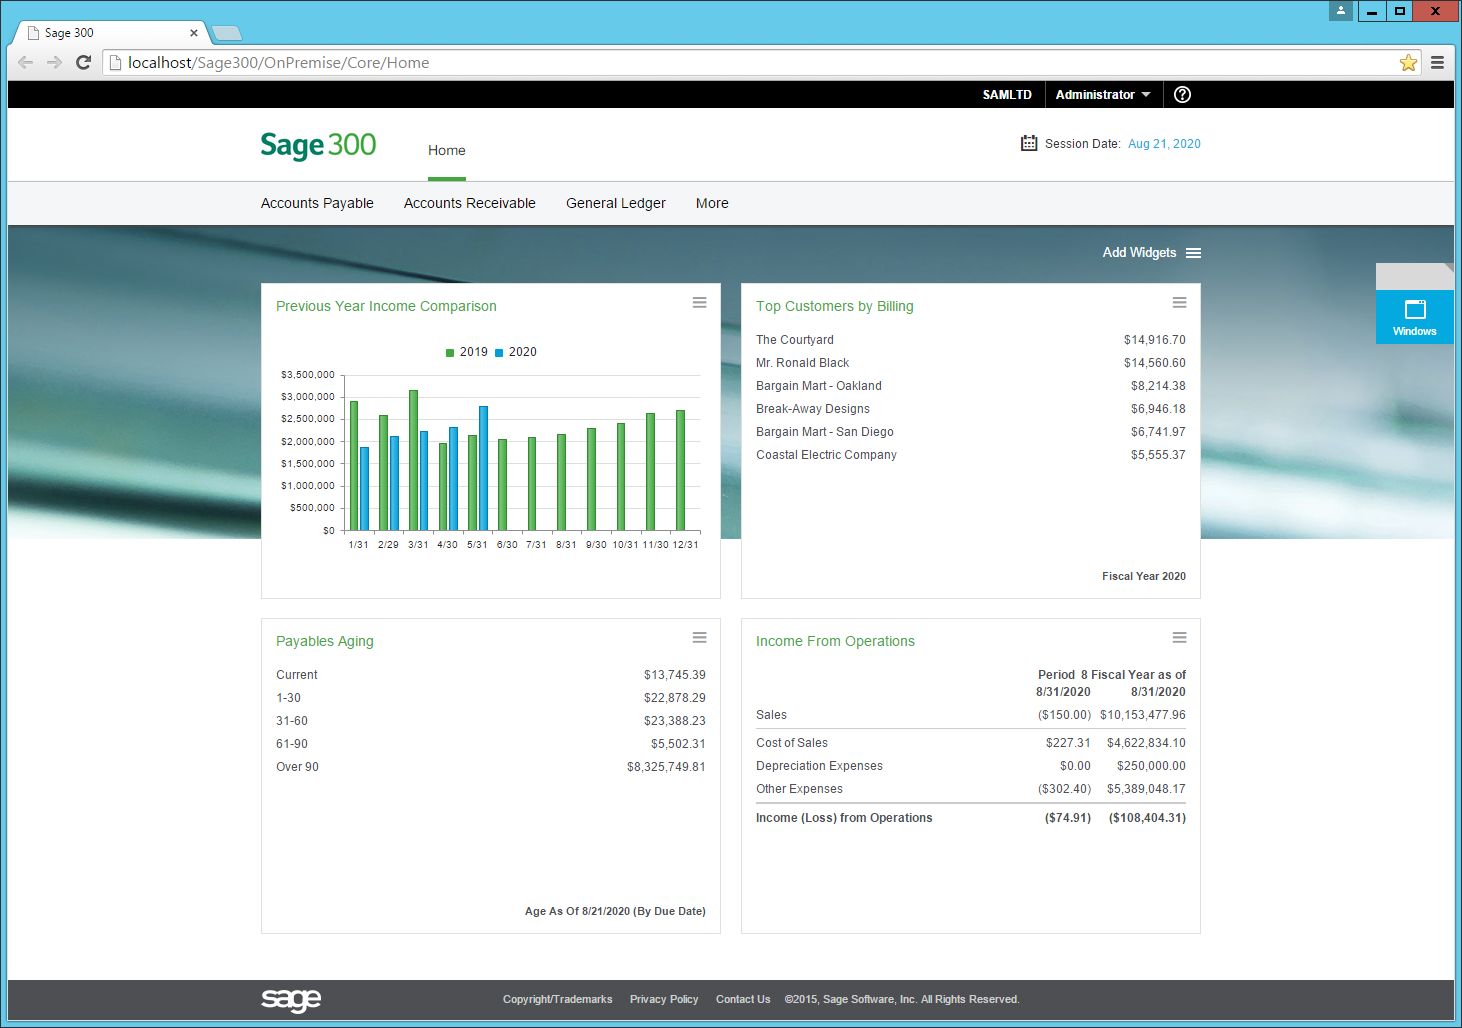
The twelve KPIs give a good selection of things from G/L, A/R and A/P since these are the accounting screens we are including with the first release. Then there will be more KPIs with the second release which includes the I/C, O/E and P/O screens and matching KPIs.
Some people love KPIs, others just find them a nuisance. Using the KPIs is entirely optional, it’s up to you to select what you wish to see. The KPIs are controlled by Sage 300 security, so if you don’t have rights for a KPI, it won’t be available to display.
Settings
Many of the KPIs have settings dialogs that you open from the hamburger menu. For instance below is the one for the Account Balances KPI where you choose the five accounts to show the balance for.
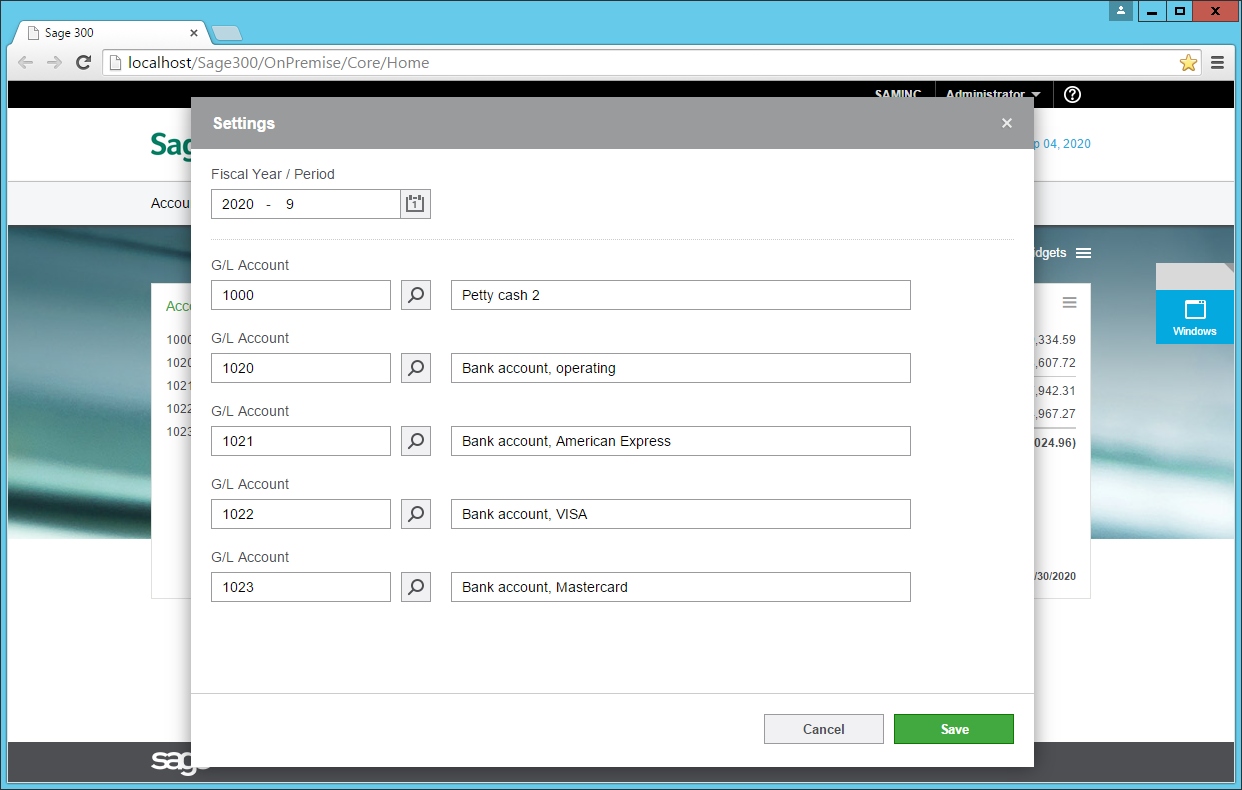
You can also edit the title of each KPI. You can re-arrange them on the screen using drag and drop. For KPIs with an associated report, there is another menu item on the hamburger menu that will open the report.
Technical Details
When we developed these, although I couldn’t blog on what we were working on, I did blog on some of the technical aspects that went into how these were implemented using CSQRY and then on caching and calculating these. For this on premise release, we aren’t implementing any of the cloud based technologies that would calculate these for you in the background. Instead we calculated these the first time you access them in a day, and then cache the result for the rest of the day. Most people open and close their browser pretty frequently so we want it to be quick. Of course you can select refresh from a given KPI’s hamburger menu to recalculate the data.
We had similar data widgets in our Sage 300 6.0 Portal, these new KPIs leverage what was developed there as well, for instance to display aging or to categorize financial data.
Summary
KPIs are a good way to see information relevant to your job quickly when you log in. Often you can use this information to decide what you need to do next, or to just keep your finger on the pulse of your business.