
If you are troubleshooting a specific X3 user's connection, can you isolate only that user's connection from within SQL Server Profiler? The answer is yes you can. In this blog I will explain where to find the user's process identifier(PID) and which column in SQL Server Profiler you would use as a filter to capture activity for that PID
The PID is a number assigned to an executable when launched by the operating system. The PIDs are unique on the same machine, you would not find the PID number 1120 twice, for example. If the task is closed, the PID number can be reused.
Where can I see a list of the user's PIDs? On the user's machine, open Task Manager and go to the Details tab. You will see a list of all the executable programs the user currently has open. You will also see a PID column with different numbers assigned to each executable.

So how do we find the PID tied to the users X3 process? First, log into X3 using the Admin account. Then, navigate to Development, Utilities, Verifications, System Monitor, and launch User Monitoring

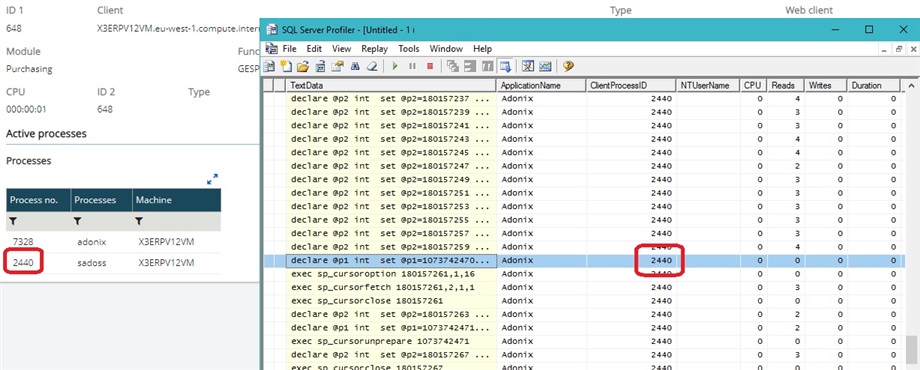
From the list of connections, locate the Type=Classic page, Login=<Target User> Folder=<Target folder>. In my example, it's the admin user and the SEED folder. Click on the number in the ID1 column which will take you to the User Monitor page. On this page, locate the Active processes section, and look in the Processes column for the 'sadoss' process. The Process number next to the 'sadoss' process is the PID we want. In my example the PID is 2440.

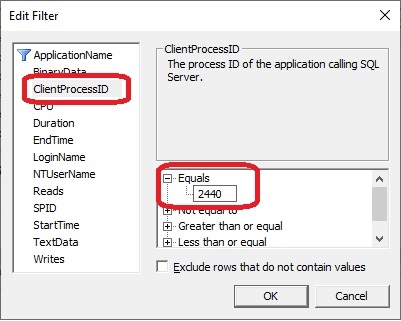
Now that we have the PID, how do I use it in conjunction with SQL Profiler to capture activity limited by that PID? On a machine with SQL Server Profiler, navigate to it and launch. Then, create a new Profiler trace using the sa login account. From the General tab, select the Standard template. Click on the Events Selection tab. In the bottom right, click on the Column Filters button. From the list, click on ClientProcessID and on the right-hand side, click on the + next to Equals to expand and allow you to type 2440 in the box. Click Ok. You are now ready to click the Run and begin the SQL Profiler trace. Note that if the user happens to logout of X3 and back into X3, you will need to go back to the User Monitor step to look up the Process number for the sadoss process again to obtain the new number.
For situations where you need to capture SQL Server activity for a specific user's process id number, try out these steps to filter the profiler trace. I hope this helps you save some time and reduces the size of your profiler trace.
