As you know that we can use the windows telnet client to simulate ADC handheld devices. Occasionally, there may be issues that are hard to identify and we can activate a debug trace in ADC server configuration for the administrator to troubleshoot those issues.
Let me illustrate how to activate the trace mode in X3 WEB server.
- The java code of the X3WEB contains trace instructions and when the trace mode is active, it send character strings via TCP / IP to an application called trace server.
- The 'trace server' application uses the TCP port 1515 and when it receives a character string from X3WEB (or other) server, it displays it in a text editor window.
- The color and the prompt make it possible to differentiate the applications emitting traces.
- Trace server is delivered with the X3WEB server and it’s stored in a sub-directory of the 'Tool' directory of the installation folder of the X3WEB server.
- Prerequisites: Install a JRE (Java Runtime Environment) on the machine on which you will launch the trace server.
- File path for X3WEB server in V11 - Sage, SafeX3, WEB236.1, Tool, WEBAPPS, WAX3TRACESERVER
- Double-click on the com.sage.x3.srvweb.wa.x3traceserver_juliet.jar file to open the “X3 Trace Server” file.
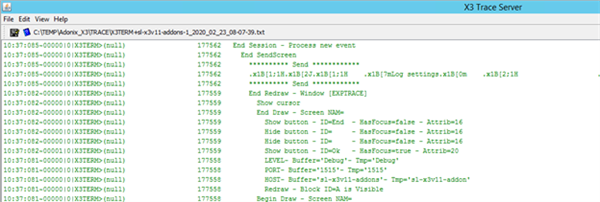
- Explanation of some of the items showed on the trace.
- 10:37:081 HH timer: MM: SS triggered at trace server launch.
- X3TERM Prompt identifies the trace of the RF server.
- 00000 millisecond counter since the start of the trail opening.
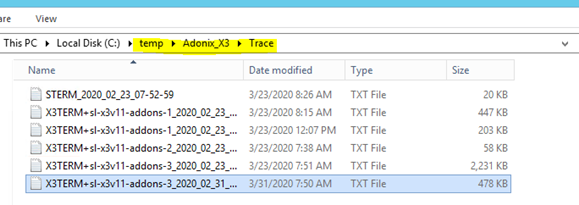
- Trace is available under c: \ temp \ Adonix_X3 \ Trace (manually create this path).
- The View menu offers options for displaying the trace
Activation of the RF/VT server trace - user session trace:
- By default, RF server trace is disabled
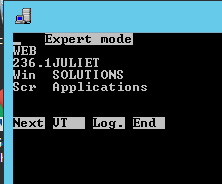
- The user can activate it by using the expert mode
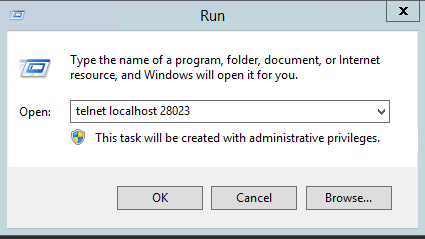
- To activate expert mode in telnet client, open the telnet client by running the following command in windows to simulate the ADC handheld device.
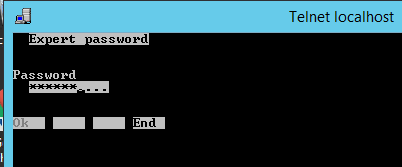
- Press both Ctrl + E and enter the password to open the expert mode screen.
- Password is listed under Safe X3 console, WEBSERV, term.ctermconfig.session.expertpwd
- Press F3 to select the Log. button
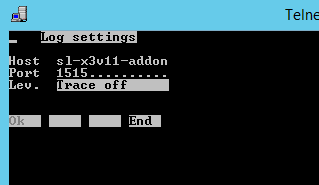
- Enter the IP address (or hostname) on which the trace server is launched
- Enter the TCP port’s number (1515) of the trace server.
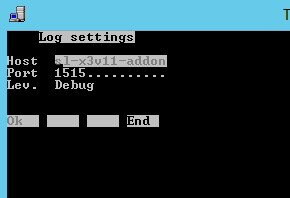
- Select the level of the trace desired.
- Use the Up arrow to select the Level and click F1 to save the selection.
- Trace off (Default level)
- Buffer
- Debug
- Parameters
- Activity
- Calls
- Note, trace must be activated before the X3 connection to benefit from the trace of exchanges between the VT server and the X3 server.
User session trace settings:
- The parameters for configuring the trace for user sessions are accessible in the advanced parameters of the console under the tree structure.
- term.ctermconfig.adxclient...
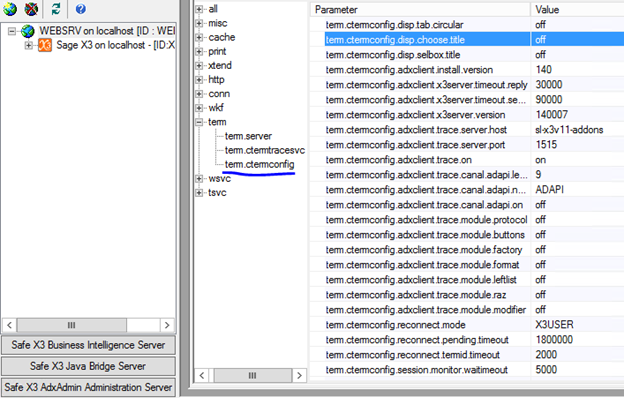
|
Parameter |
Value |
|
trace.server.Host |
hostname or IP address of the trace server |
|
trace.server.Port |
TCP listening port of the trace server |
|
trace. On |
activation of the trace, the name of the channel is X3TERM |
|
trace. canal.adapi.level |
trace level, by default ‘9’ |
|
trace.canal.adapi.name |
name of the ADAPI channel for the trace of exchanges between the RF server and the X3 server, by default ‘ADAPI’ |
|
trace.canal.adapi.on |
trace of exchanges between the RF server and the X3 server |
|
trace.module.protocol |
trace option for RF server / X3 server exchanges |
|
trace.module.buttons |
trace option for RF server / X3 server exchanges |
|
trace.module.factory |
trace option for RF server / X3 server exchanges |
|
trace.module.format |
trace option for RF server / X3 server exchanges |
|
trace.module.leftlist |
trace option for RF server / X3 server exchanges |
|
trace.module.raz |
trace option for RF server / X3 server exchanges |
|
trace.module.modifier |
trace option for RF server / X3 server exchanges |
- Note, to activate the trace, the user must have a session running.
- If the error occurs before the opening of the session it is necessary to activate the trace of the VT server as soon as it is launched
RF server trace outside user sessions:
- The RF server trace configuration parameters are accessible in the advanced parameters of the console under the tree structure:
- term.ctermtracesvc...
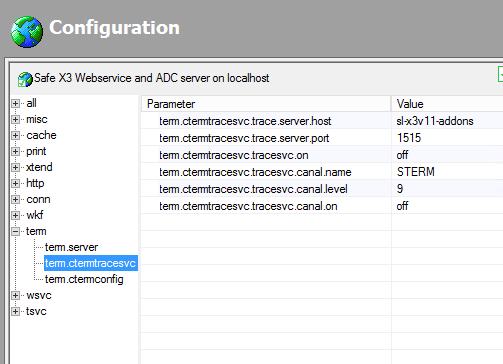
|
Parameter |
Value |
|
trace.server.host |
Hostname or IP address of the trace server |
|
trace.server.port |
Default trace server TCP listening port = 1515 |
|
tracesvc.on |
Enable trace, default = Off |
|
tracesvc.canal.name |
Default channel name = STERM |
|
tracesvc.canal.level |
Default trace level = 9 |
|
tracesvc.canal.on |
Open the trace channel, default = Off |
Sample trace highlighting an error:
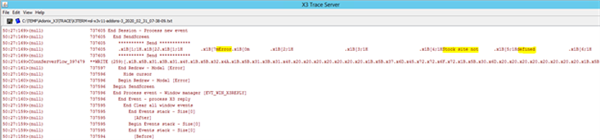
Trace files are stored under temp, Adonix_X3, Trace: