
Have you wanted to be able to run a SQL Server profiler trace and initiate it directly from X3? In this blog we will look at where the option is to let us do this. We will look at the options available to include in the trace as well as where to go to review the output of the trace file.
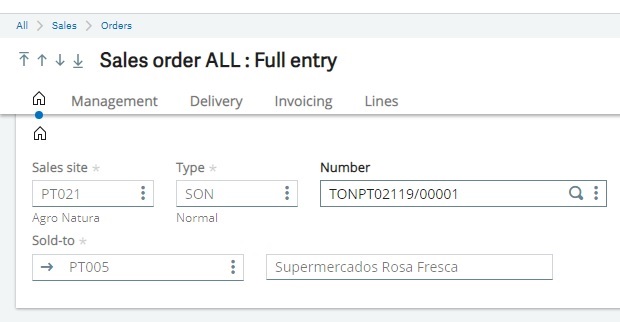
In this example, we will look at how to setup a SQL Server trace from the Sales Order entry screen. But the setup SQL Server trace is available in the same area on other screens as well. Let's go to GESSOH(Sales Order Full entry)
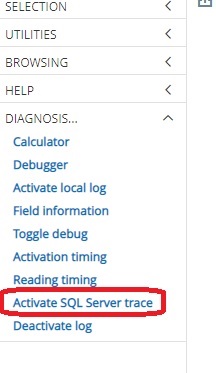
Notice on the right-side menu under the Diagnosis section, there is an option named Activate SQL Server trace. Let's click that option.
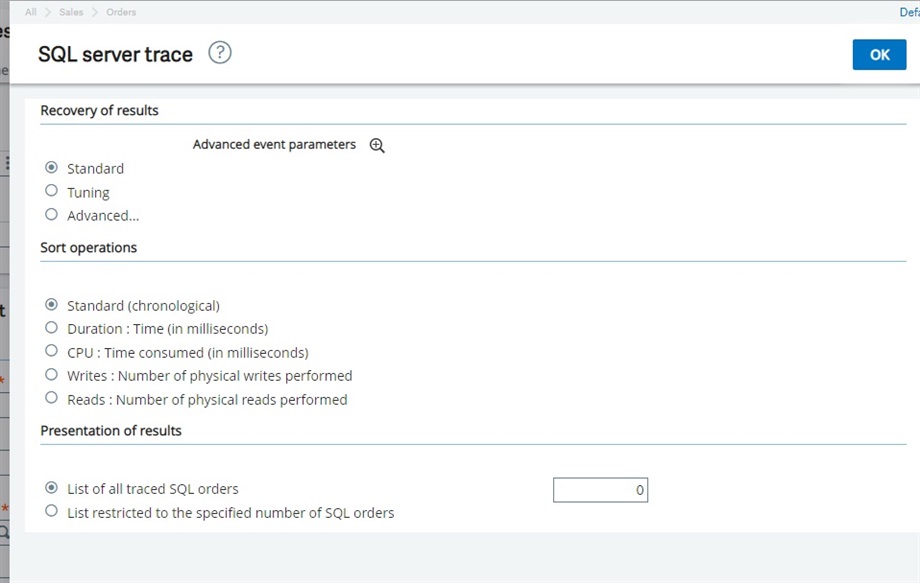
This will bring up the screen with the options that are available to trace. You can select Standard, Tuning, or Advanced. There is also an option to select Advanced event parameters. If you are going to trace steps that lead to an error that you believe may be coming from SQL Server and it is not performance related, then select Standard. If it's a performance related issue, you can select Tuning. Also, in the Sort operations area, I would also select Standard to match the Standard option or, if its performance related, select one of either Duration or CPU. The Writes and Reads are also performance related, so you could try including those options as well in separate trace runs. (This is because you can only select one) I would leave the Presentation of results option set to List of all trace SQL orders instead of limiting to a few sales orders.
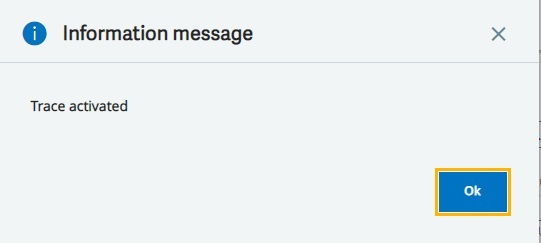
After you make your selection, click the OK button and you should be prompted with an informational message box that tells you the trace has started.
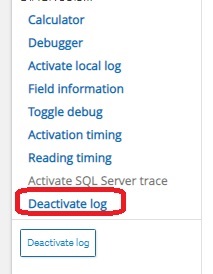
After you click OK on the information message-box, begin to go back to the sales order entry screen to reproduce the issue you are troubleshooting. Whether it's a performance related issue when pulling up a sales order or some type of error message that is occurring. Then, when you have reached the point that you were able to duplicate the problem, go back to the right-side menu and select Deactivate log.
After a moment, the screen should display the log reader showing you the details of the SQL Server trace.
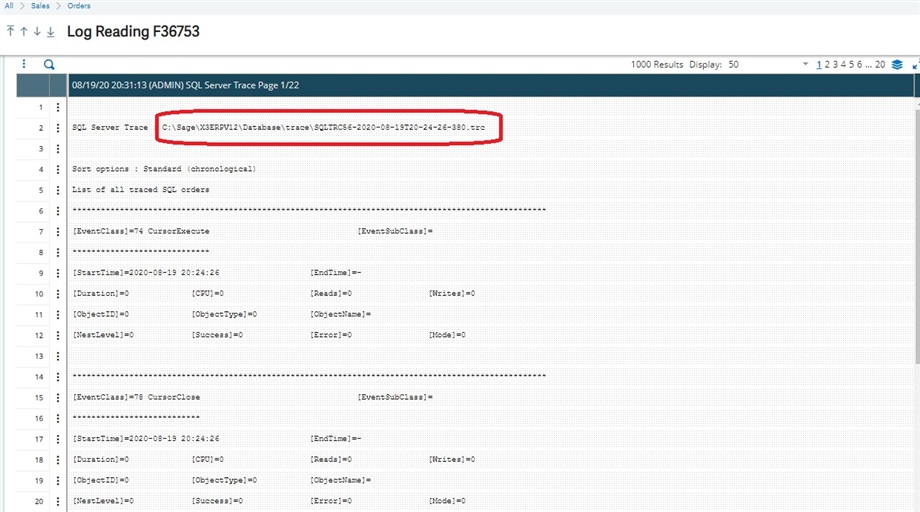
The location of the file created is at the very top of the log. To review the output, scroll downward and/or click on the next page to display more details that were captured. You can also use the search icon to look for keywords inside the log.
Do be careful when using this tool. Running s SQL Server trace does incur performance on the SQL Server machine. Once you activate it, quickly spend time duplicating the issue and then deactivate the trace.