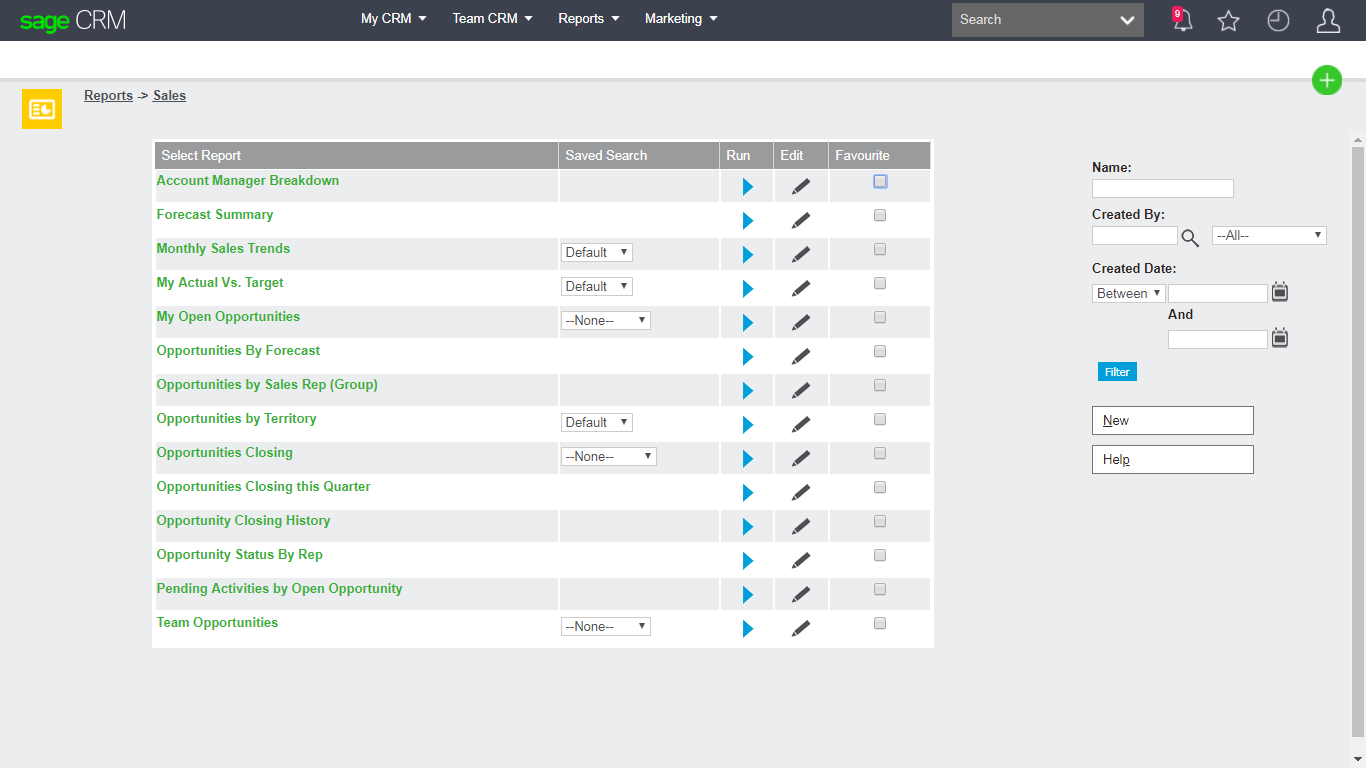
A customer had a requirement to see which reports had charts associated with them so they could consider them as Chart Gadgets in their Interactive Dashboard. It is not immediately clear from the standard report screen which reports might have a Pie chart or HBar associated with them:
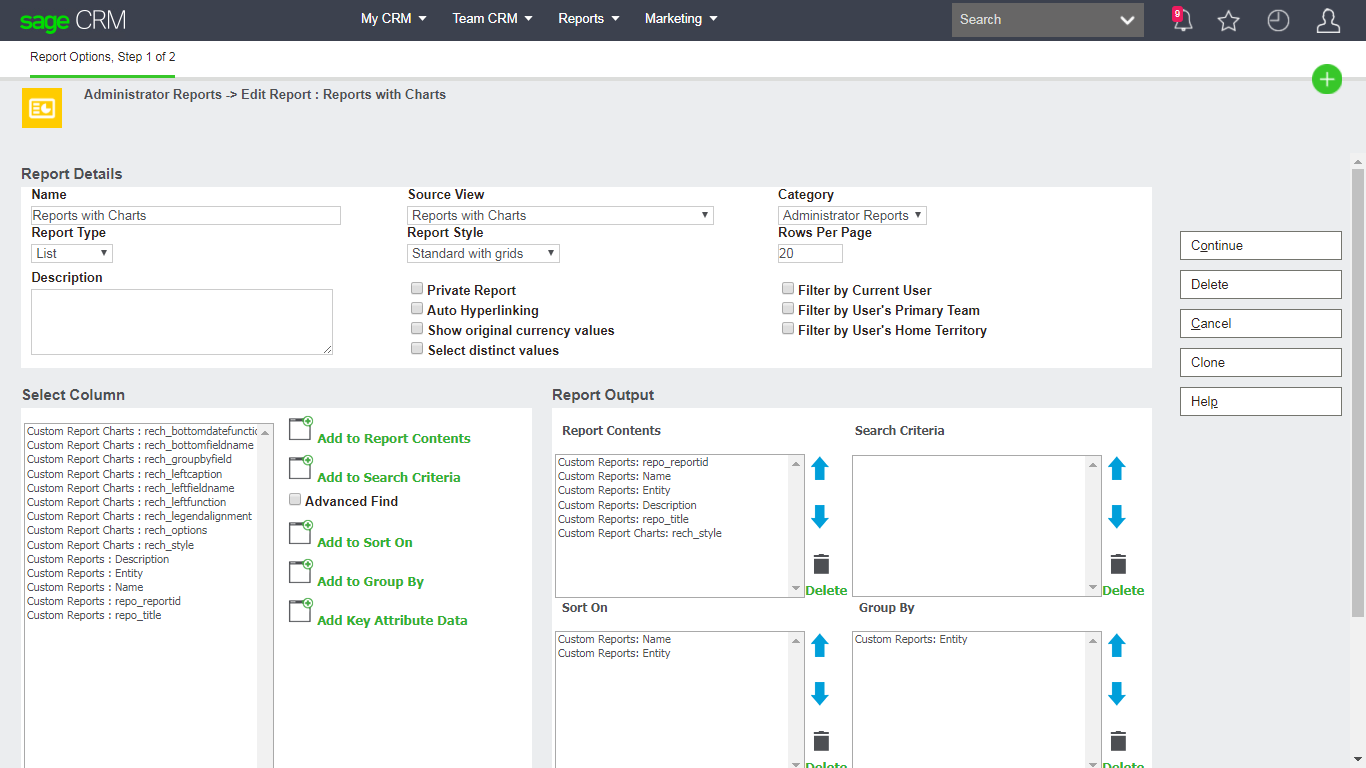
To allow me to see which reports had charts I created a new Administrator report based on a new view that brought together the information from the various tables that are used to define a report.
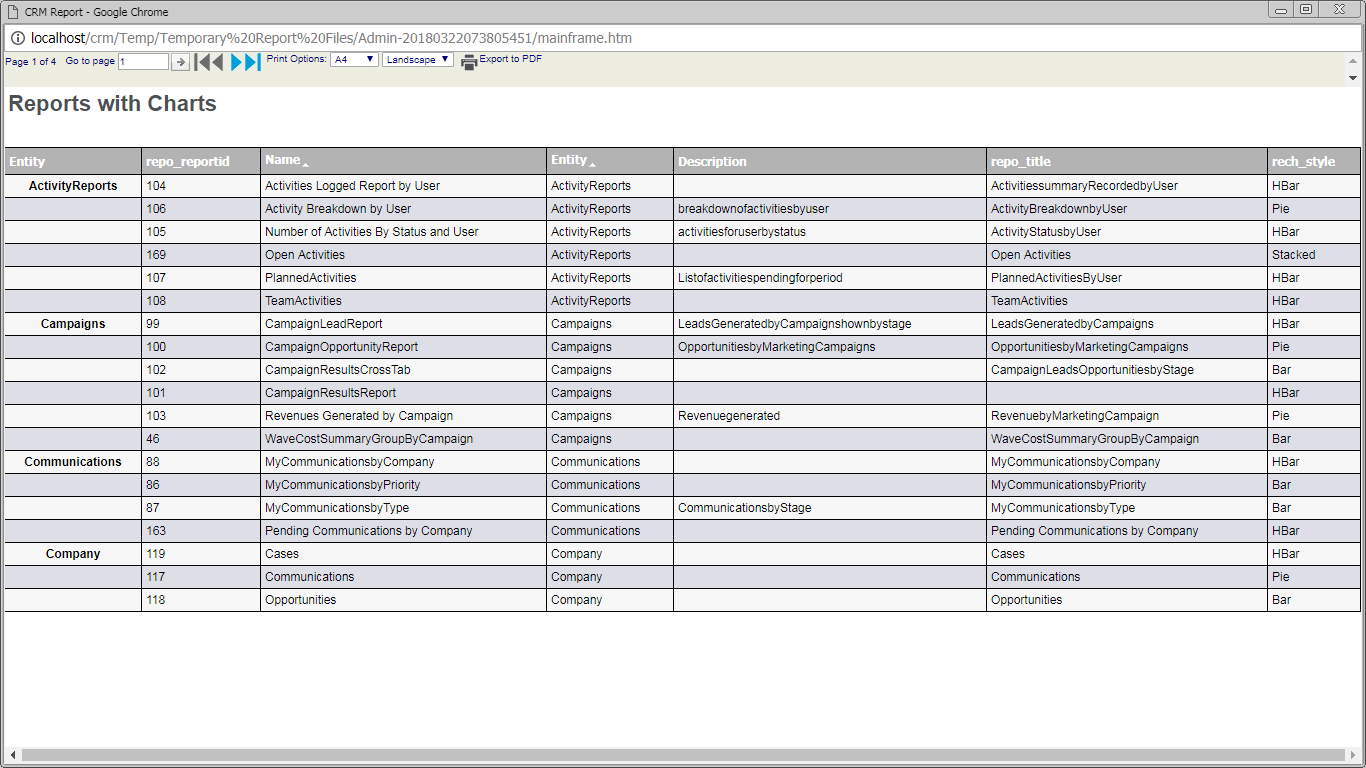
This is a screen shot of the report.
You can download the a component which will install the report from the Example Components and Developer Resources folder.
The underlying view was called "vReportCharts" and was defined under the System secondary entity
Administration -> Customization -> System
and used the following SQL
SELECT dbo.Custom_Reports.Repo_ReportId, dbo.Custom_Reports.Repo_Name, dbo.Custom_Reports.Repo_Category, dbo.Custom_Reports.Repo_Title,
dbo.Custom_Reports.Repo_Description, dbo.Custom_ReportBands.ReBa_ViewName, dbo.Custom_ReportCharts.ReCh_Options,
dbo.Custom_ReportCharts.ReCh_BottomDateFunction, dbo.Custom_ReportCharts.ReCh_BottomFieldName,
dbo.Custom_ReportCharts.ReCh_LeftCaption, dbo.Custom_ReportCharts.ReCh_LeftFieldName, dbo.Custom_ReportCharts.ReCh_LeftFunction,
dbo.Custom_ReportCharts.ReCh_LegendAlignment, dbo.Custom_ReportCharts.ReCh_Style, dbo.Custom_ReportCharts.ReCh_GroupByField
FROM dbo.Custom_ReportBands INNER JOIN
dbo.Custom_Reports ON dbo.Custom_ReportBands.ReBa_ReportId = dbo.Custom_Reports.Repo_ReportId INNER JOIN
dbo.Custom_ReportCharts ON dbo.Custom_ReportBands.ReBa_ReportBandId = dbo.Custom_ReportCharts.ReCh_ReportBandID
For background reading about the structure of the Reports section please refer to
Once the view was created, the report was easy to define: