

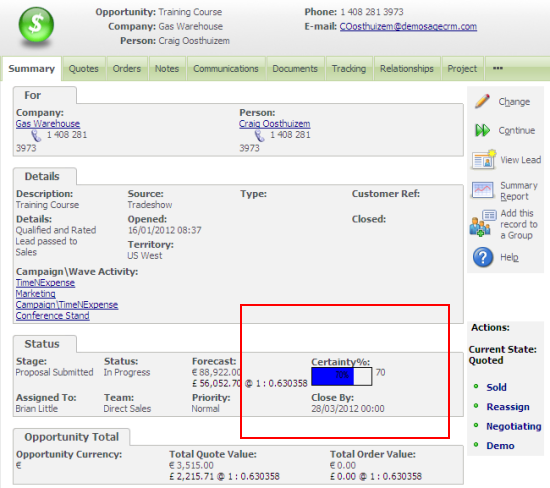
An on Premise Sage CRM customer had the the requirement to display the Opportunity Certainty data graphically.
This can be achieved using the GraphicBlock object to create a graphic that can then be displayed by the Caption property of the field.
You can learn more about the graphic object in the online Developer Guide.
The script in the image above has been added to the OpportunityStatusBox which belongs to the OpportunityProgress table.
The javascript below was then added to the create script of the oppo_certainty field.
var strCertainty=CRM.GetContextInfo('opportunity','oppo_certainty');
var graphic;
graphic=CRM.GetBlock('graphic');
graphic.DisplayForm = false;
graphic.Border=1;
graphic.ImageWidth=100;
graphic.ImageHeight=20;
graphic.Animation('Add','1');
graphic.ImageWidth=strCertainty;
graphic.ImageHeight=20;
graphic.GradientFill('Blue','Blue','LeftToRight');
graphic.TextOut(40,1,strCertainty+'%',true);
graphic.Animation('Add','100');
Caption = CRM.GetTrans("colnames","oppo_certainty")+":"+graphic.Execute();
CaptionPos = 3;
The main advantage of building a graphic using the Create script is that it allows you complete freedom to access data from within Sage CRM and use any other of the API calls in javascript that you might need.

