

Updated: 03 August 2023
Please note this document and all other documents it links to are living documents so will evolve over time as new things are discovered, new functionality is provided, best practises adjusted and/or when I get time to add content; so please make sure you come back and visit this source document often.
Contents
Performance tuning your Sage X3 system: MongoDB
Gathering performance statistics
General blogs, KB articles, etc.
Introduction
MongoDB is used by X3 to store the administration data, such as that which is viewed via the Administration menu section. It also is used to store certain temporary information, such as user session information or when users generate reports to view, amongst others. MongoDB is designed to handle huge amounts of operations per second and so should not really ever be troubled by the workload X3 is likely to throw at it.
Performance issues
The main issue you may see from a performance perspective is that MongoDB process gradually starts talking a large amount of memory, and when it hits about 3GB or so will cause MongoDB service to fall over. This is due to the way MongoDB caches data and can be addressed by tuning the caching parameters described in “MongoDB is stopping unexpectedly and randomly” https://us-kb.sage.com/portal/app/portlets/results/viewsolution.jsp?solutionid=221924460116352
Gathering performance statistics
MongoDB provides tools you can use to interrogate how MongoDB is performing. The Sage Support Investigation Scripts package these into easy to use scripts.
|
Sage script name |
MongoDB tool |
MongoDB Documentation link |
|
mzRunMongoTop.cmd |
mongotop |
|
|
mzRunMongoStat.cmd |
mongostat |
|
|
mzServerStatusRun.cmd |
db.serverStatus() |
https://www.mongodb.com/docs/v4.4/reference/command/serverStatus/ |
- mongotop shows time spent reading and writing the data
- mongostat shows basic system usage (CPU, memory, network) and number of operations
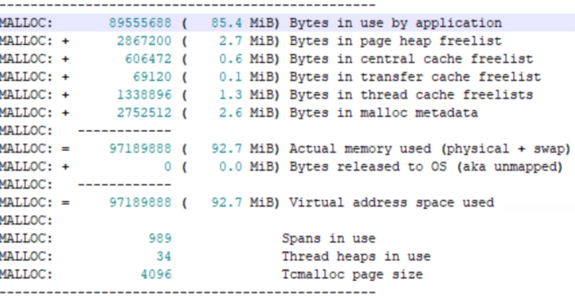
- serverStatus gives a huge range of statistics in all areas of mongodb operation, so should be the source of a wealth of useful information for troubleshooting. The output I’ve found useful in the past was the MALLOC section of tcmalloc section (Memory allocations):
Database profiler
MongoDB includes a database profiler so you can gather information about running operations. I don’t remember having to run it as part of an investigation, but it can be enabled if needed. See https://www.mongodb.com/docs/v4.4/tutorial/manage-the-database-profiler/ for details.
Sharding
Sage specifically support the use of Replica Sets which provide redundancy and High Availability. However, in MongoDB it is Sharding that provides performance for high throughput operations. As mentioned earlier, it is highly unlikely you would need to implement Sharding for any X3 workload. You should also bear in mind that Sage do not support nor document how to achieve this configuration, so you would need to review the MongoDB documentation https://www.mongodb.com/docs/v4.4/sharding/ and perform your own testing of normal operations as well as ensuring your configuration survives upgrades, etc.
General blogs, KB articles, etc.
MongoDB is stopping unexpectedly and randomly (KB article)
MongoDB Performance (MongoDB documentation)
