

Updated: 19 August 2022
Please note this document and all other documents it links to are living documents so will evolve over time as new things are discovered, new functionality is provided, best practises adjusted and/or when I get time to add content; so please make sure you come back and visit this source document often.
Contents
Performance tuning your Sage X3 system: Elastic Search
General blogs, KB articles, etc.
Introduction
Elastic Search provides the ability to do a search through the X3 data and functions in a natural and intuitive way. This is described in more detail in blog “What does Elastic Search do anyway?“
Potential issues
Elastic search is taking too much RAM
Elastic Search is designed to return search results as soon as it can, so will cache as much information as it can in memory to speed up responses. Over time Elastic Search can take up to the maximum configured memory, which by default is 2GB. If this is too much overhead for your server, you can configure Elastic Search maximum memory to be a lower value.
The steps to change the Elastic Search memory settings are documented at https://www.elastic.co/guide/en/elasticsearch/reference/7.17/advanced-configuration.html#set-jvm-heap-size
"To configure the heap size, add the Xms and Xmx JVM arguments to a custom JVM options file with the extension .options and store it in the jvm.options.d/ directory. "
For example, to set the maximum heap size to 512MB, set both Xms and Xmx to 512MB:
- Create file “JVMmemory.options” in “..\ElasticSearch\config\jvm.options.d” directory and add the following entries:
-Xms512m
-Xmx512m
- Restart your Elastic Search service and thats it you're done!
To confirm the results, check the log file "ES-<HOSTNAME>.log" located in directory "..\ElasticSearch\logs" where you will see the "JVM arguments" being passed.
Elastic Search keeps chewing up CPU
If you are seeing the “Java” process belonging to Elastic Search taking a lot of CPU then it is likely Elastic Search is running an index update. The index update can be run manually but should be scheduled to run regularly so it may be the schedule has been set at an inappropriate time, is running too often or is perhaps deleting indexes before update unnecessarily.
You can check the Elastic Search logs to see activity, for example for messages relating to “create_mapping“ and “update_mapping”
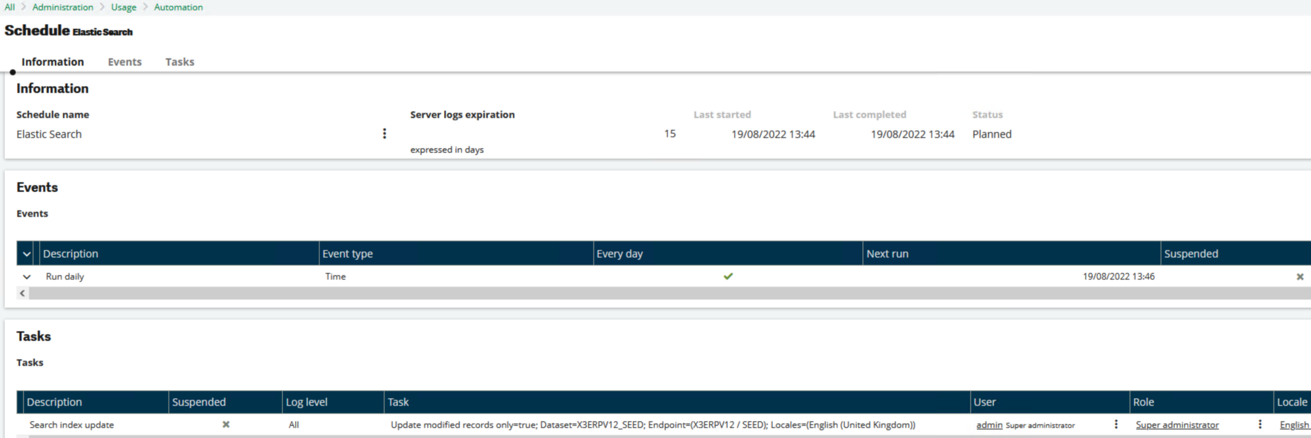
In X3 review any schedules created for Elastic Search in Administration, Usage, Automation, Scheduler. The logs relating to the schedules are in “Server logs”. Generally, you only need to run Elastic Search updates with “Update modified records only” which is the fastest option and so will take least CPU time.
Elastic Search logs are taking a lot of disk space
Check the Elastic Search logging settings, defined in “log4j.properties” located in the “..\ElasticSearch\config” directory. This is documented at https://www.elastic.co/guide/en/elasticsearch/reference/7.17/logging.html. The default settings should rollover and compress the logs daily, and automatically delete after 7 days. Also the default log level should be “info” but you could reduce this to “error” if you’re getting too much data in the logs.
General blogs, KB articles, etc.
What does Elastic Search do anyway? (Blog)
Elastic Search presentation from Sage X3 Technical Support Tips and Tricks (September 2021) (Blog)