

You are running a report from Sage X3, but it is not behaving as you expect. What debugging or tracing is available to help investigate further?
I should say first that much of my discussions in this article are covered in the online help article “Print Server Presentation and Operation Guide” This article has some great information about printing, but I always have trouble finding it when I need it!
As the above article reminds us, the path a report goes to get generated is firstly in Sage X3 code, then the report is pushed out to Crystal Reports which does the SQL query to pull the data for the report, then the output gets pushed to the Windows printing. This gives us at least three different areas to review if a printout is not correct, printing slowly, or not at all!
In this blog article I want to discuss the following topics:
- How to review current printing activity in Sage X3
- Generating a X3 engine trace and/or timing trace
- What logging is available from the X3 Print Server
- What Syracuse layer logging is useful
- Generating a SQL trace
- Testing the Print Server database connectivity
1. How to review current printing activity in Sage X3
You can see the printing activity going on in Printouts, Printouts, Print supervision
See the online help at https://online-help.sageerpx3.com/erp/12/staticpost/print-supervision/
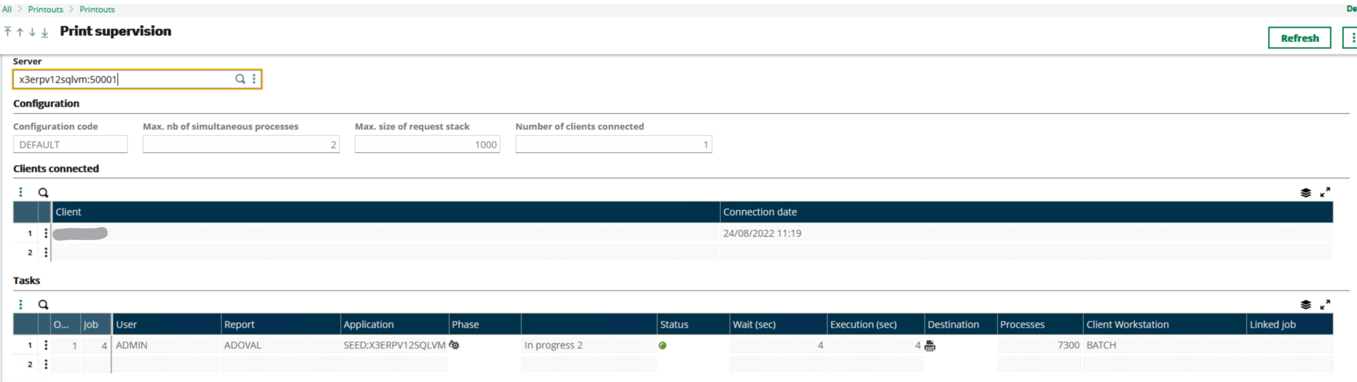
This screen provides details about the configuration of the Print Server (Number of simultaneous processes for example) which clients are currently processing print requests and in the “Tasks” section shows which reports and their status, along with the length of time taken so far. You also can cancel a print job if needed.
If you want to tune the configuration of the Print Server, this is done in the X3 Console and will be discussed in the “Performance tuning Sage X3: Index” blog
2. Generating a X3 engine trace and/or timing trace
The KB article "How to run an Engine trace in Sage X3" covers how to generate an Engine Trace, so how does this relate to printing?
Generating X3 Engine Trace using X3 Session Logs
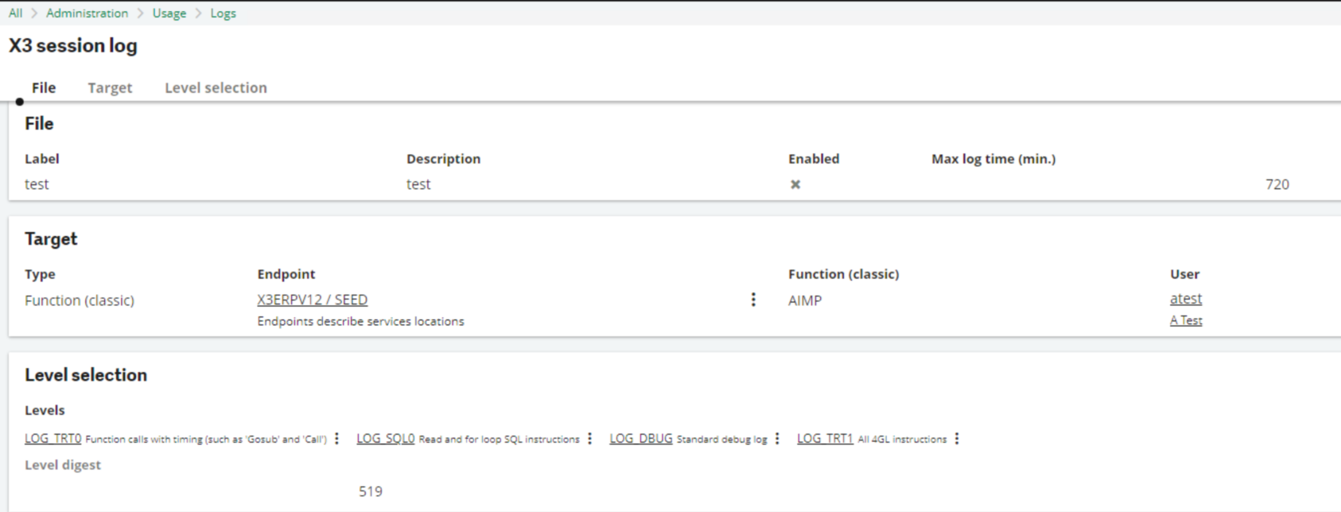
Unfortunately, in “X3 session logs” there is no option to explicitly trace a specific report. We can however trace AIMP function and enter a username, although this will trace all reports for that user.
If running a report through the Batch Server, we can specify the batch query number so this provides a more precise way to trace a single report run.
Using the calculator
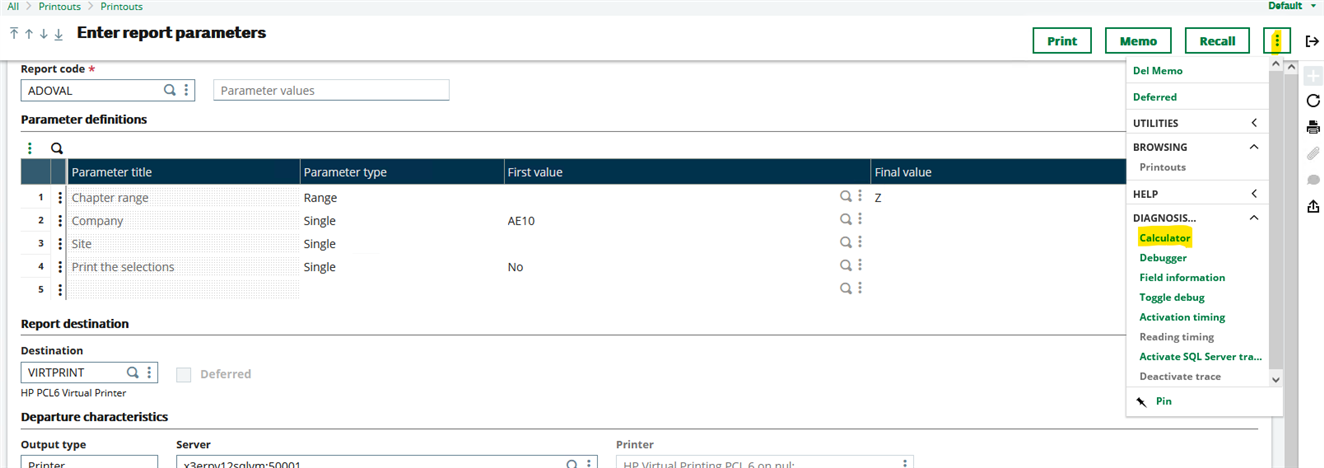
You can use the calculator (Actions, Diagnosis, Calculator) to manually start and stop Engine Tracing, so can still do that for printing also. NOTE: in this case, don’t enable Engine tracing until you get to the report parameters entry screen.
Which logging level to use
Whichever method of generating the trace, I would normally pick the following level selection which gives the debug output. This is useful for the reports as you can then see the parameters used (log level 519)
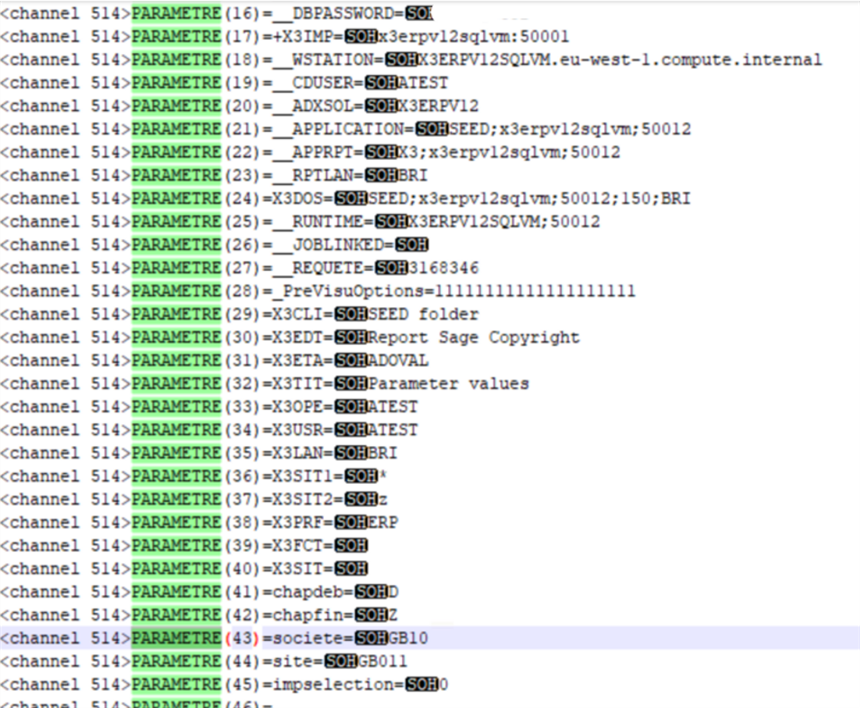
In this case, when I run a report with the following parameters:
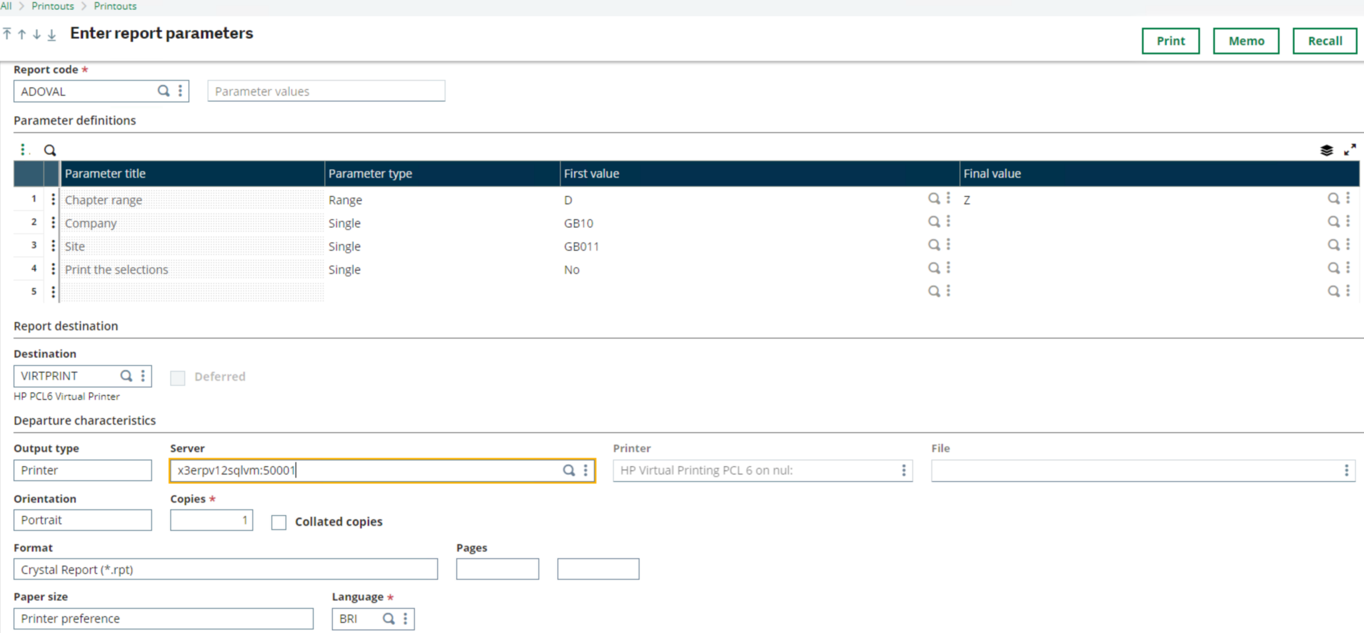
I can see in the engine trace output these being used:
Generating a timing trace
Is a timing trace all that useful? We can see from the Print Server logs (discussed below) how long it takes to process a report once it has reached the Report Server component, so a timing trace may not give you anything which is all that useful, but let’s take a look at what is does show…
In Printouts, Printouts, Printouts select the report code and enter any parameters
Enable timing trace: Actions, Activation timing

Click “Print” to generate the report, then disable and review timing trace: Actions, Reading timing
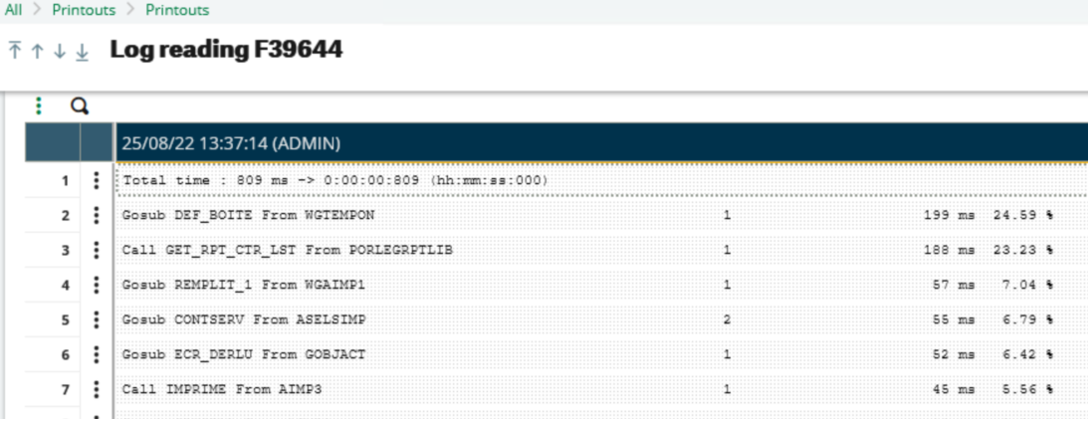
The timing trace is only showing the X3 code part of the report submission, so in this case completes in less than as second. The report itself took 20 minutes to process once it was received by the Report Server. Having said that, a timing trace could be useful for more complex reports, where they are calling standard or specific code as part of the report pre-processing.

3. What logging is available from the X3 Print Server
Standard logging
In the print server logs by default, you can see in the “..\SafeX3\PrtSrv\logs” directory the DEFAULT_exception*.log and DEFAULT_activity*.log which show basic errors and normal activities on the Print Server respectively.
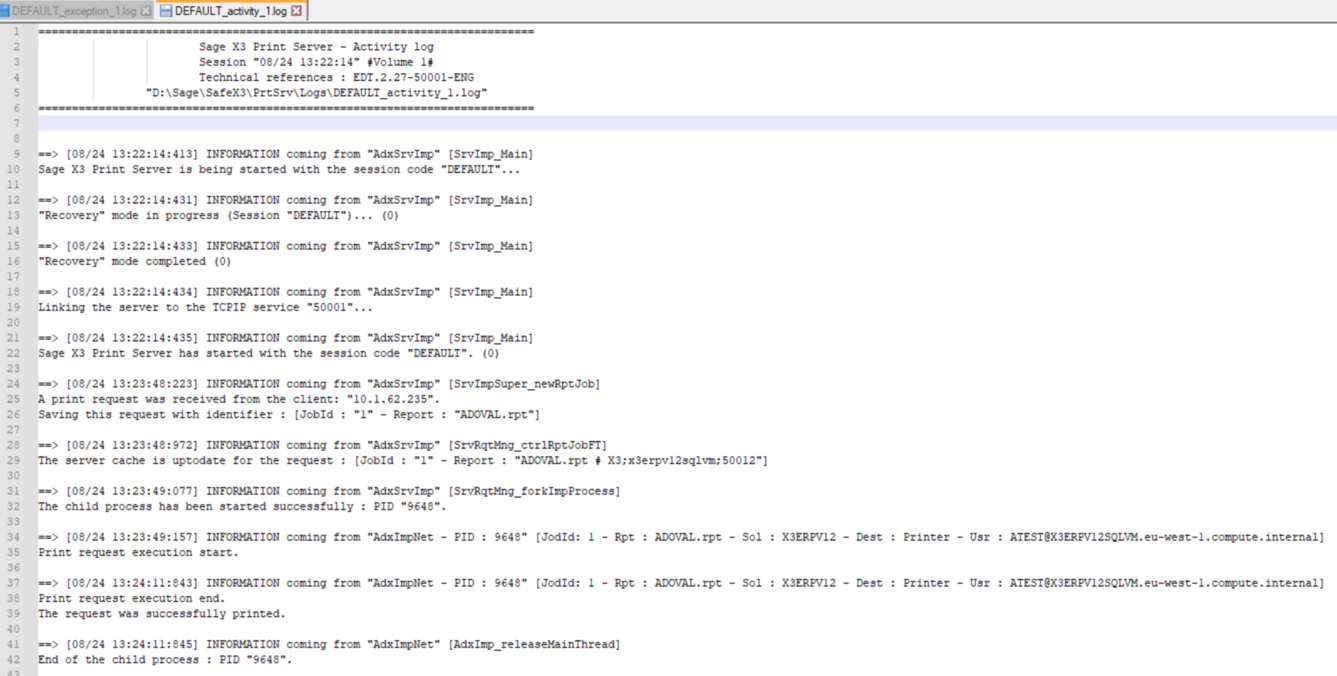
You can immediately see from this logging the date/time the Report Server started processing each print job and the end time, so you can see how long each report took to run once received by the Print Server.
If there are errors detected in the print job, then you may find additional information in the “..\PrtSrv\Temp” directory, in file name “RPT_Trace_<NAME><JobId>.log”
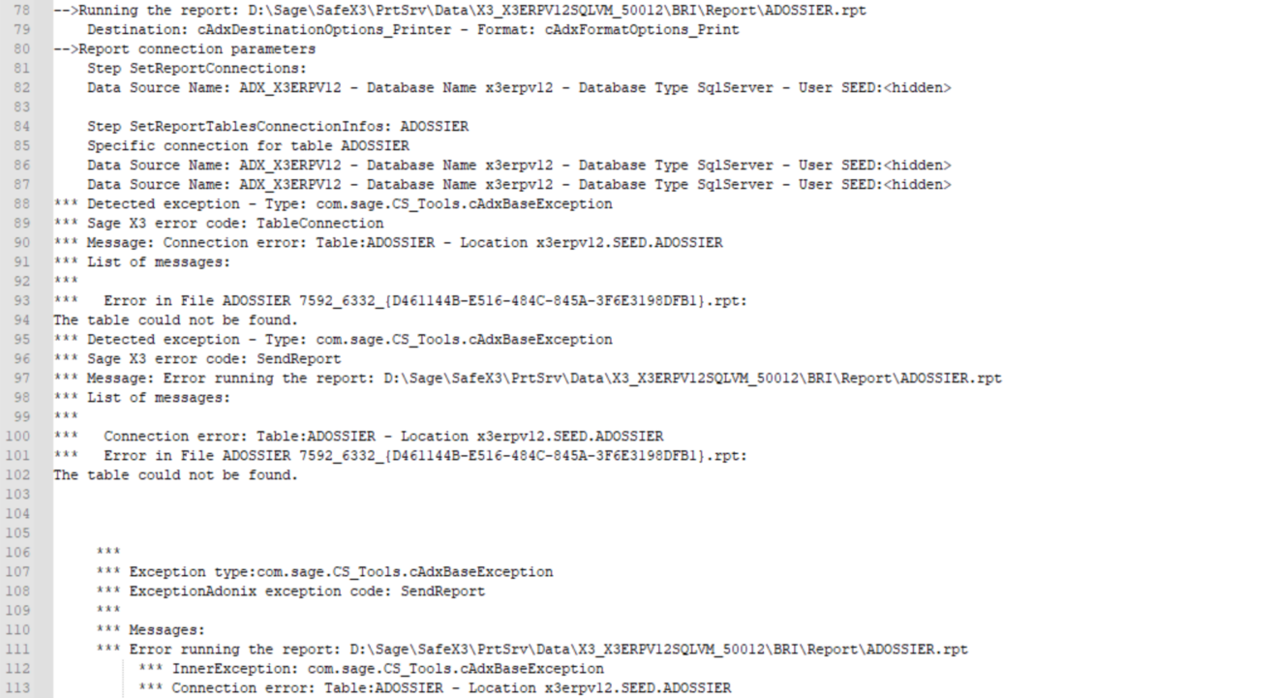
For example, when I ran a report which generated an error condition, in the exception log I see that an error has occurred:
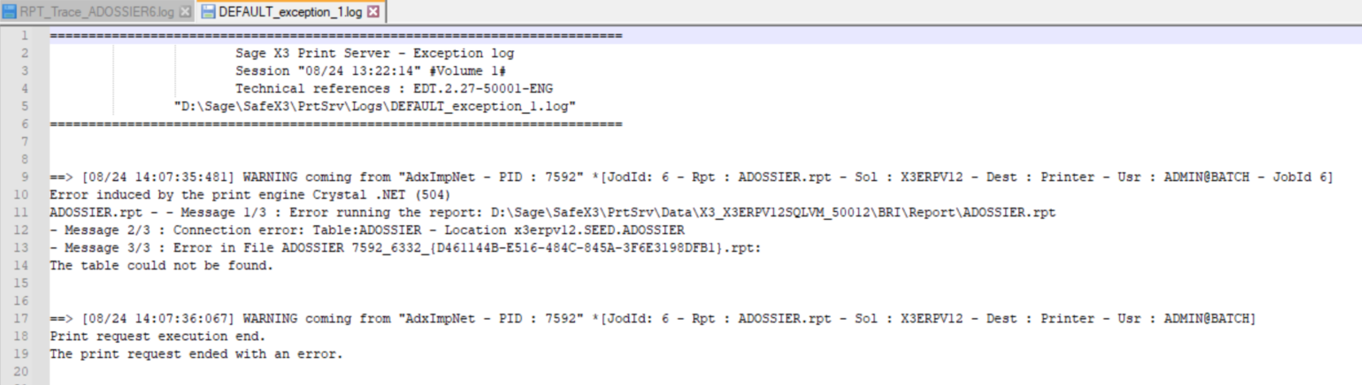
The RPT_Trace log then shows the detail of the error:
Windows Event logs
Errors are logged into the Windows Application event log, so you may find interesting errors relating to “AdxImpNet” in there. You can use the “mzEventLogRun.cmd” script from “\InvestigationScripts\PowerShell” directory to pull out this information easily.
Running Print Server in debug mode
When running as Windows Service
The easiest way to start debug tracing for all reports is to use the "start parameters" on the Windows Service.
Stop the X3 Print Server service.
Add “/d” to the Start parameters, then startup the Service.
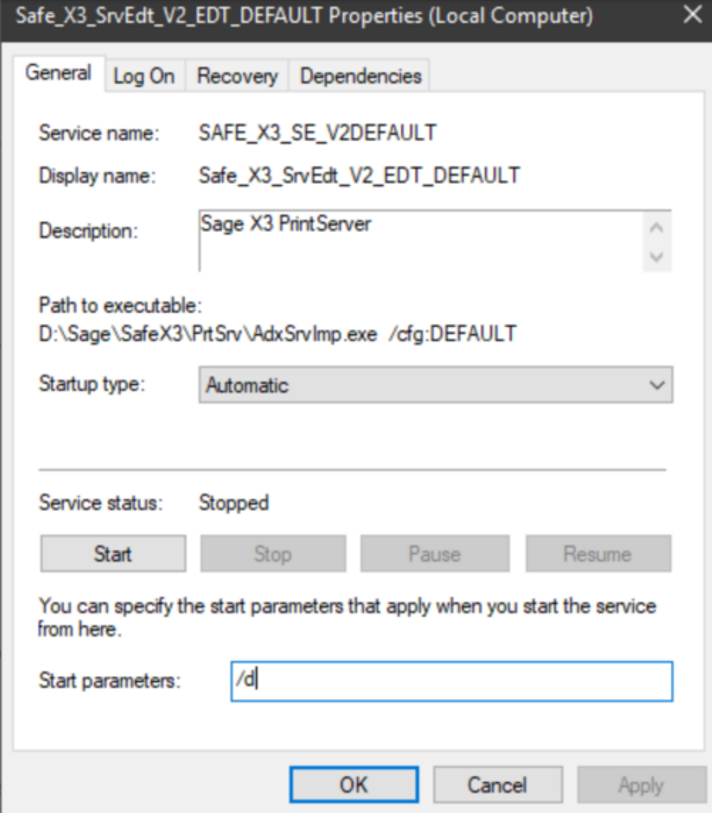
You are now running in debug mode.
To disable debug mode, simply restart the Print Server service again, as the Start parameter is not retained.
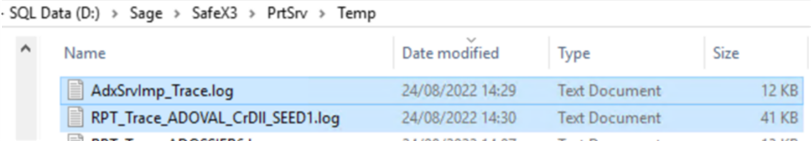
In the “..\PrtSrv\Temp” directory there is now a new “AdxSrvImp_Trace.log” file being written for the Print Server service activities. Every report generated will now also create a debug file in the same directory.
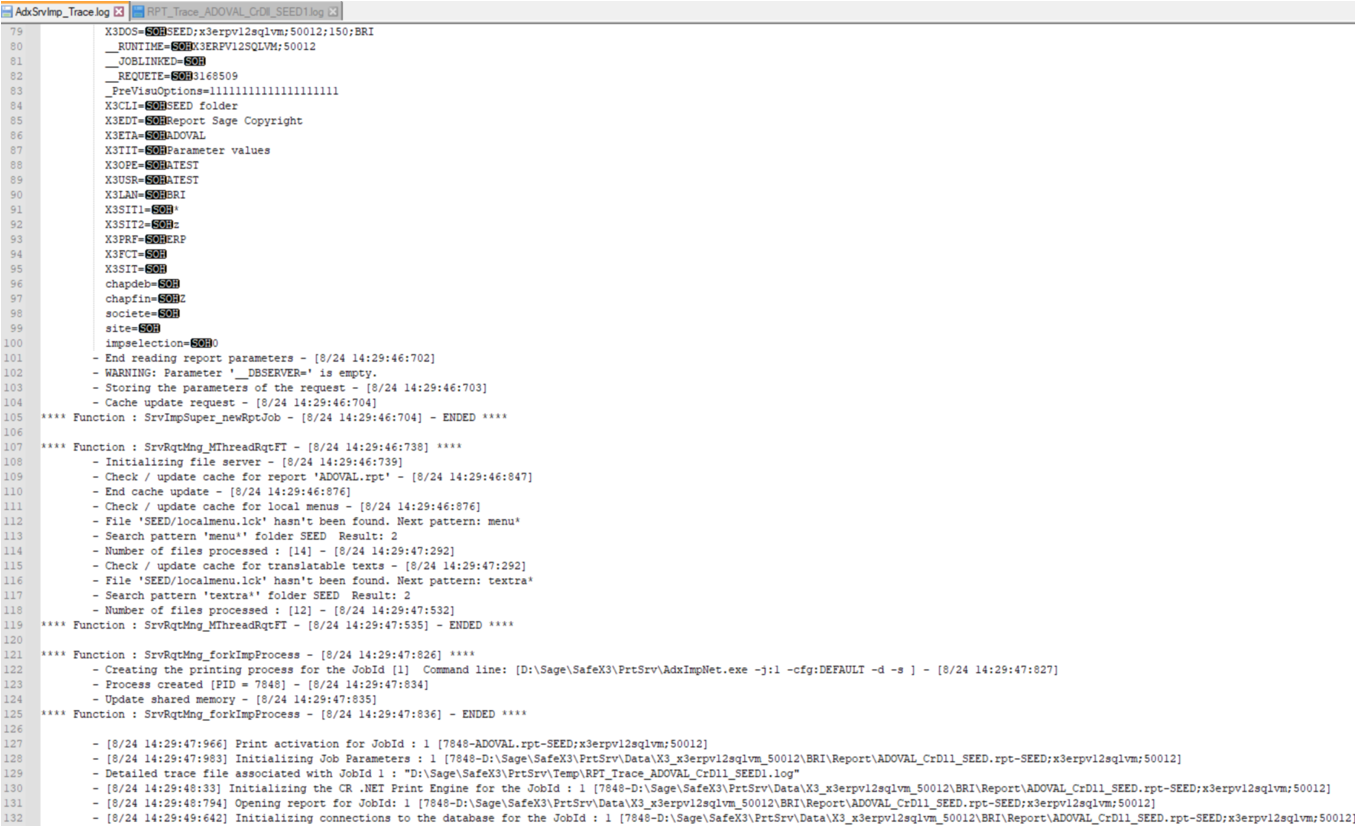
In the AdxSrvImp_Trace.log we see more details for each job submitted, including the parameters passed, and date/time of each printing phase:
The RPT_trace*.log file for the report itself shows a lot of detail around all aspects of the report run. Depending on the issue being investigated the most interesting aspects in the log may be:
- the SQL being executed
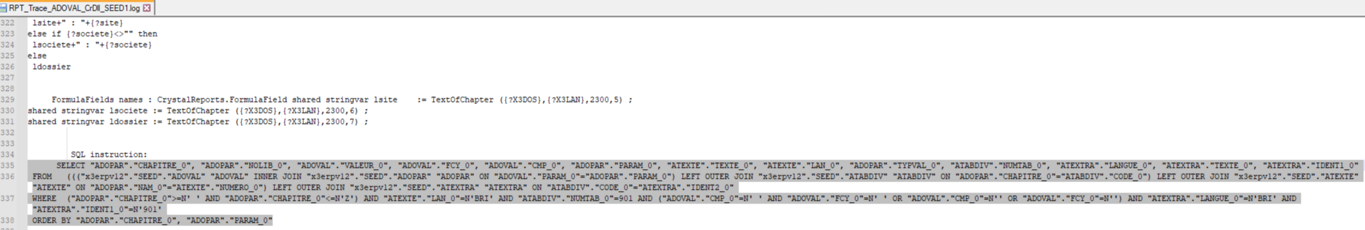
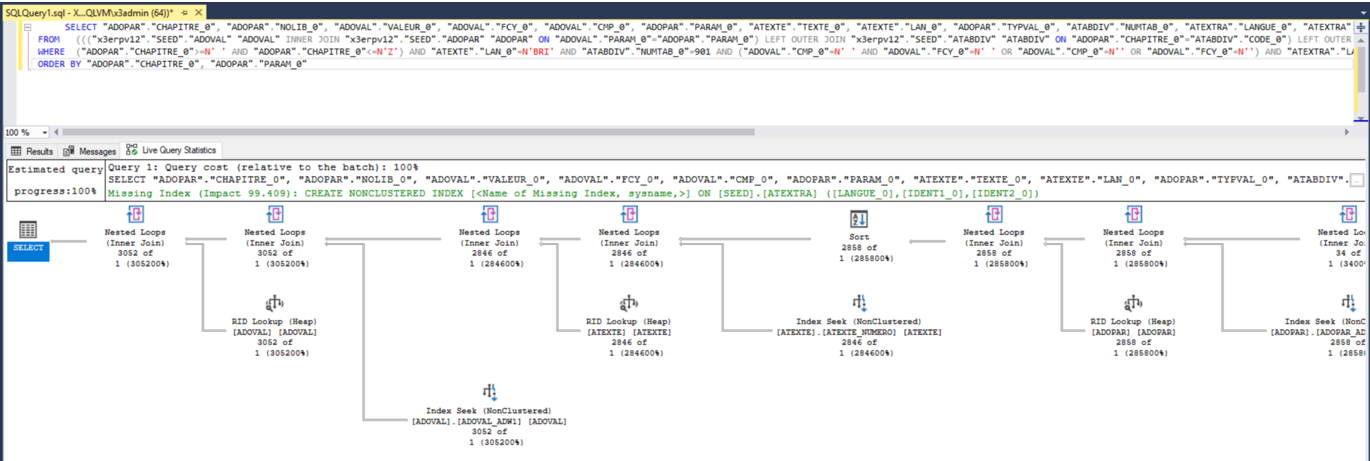
This is the SQL generated by Crystal Reports and includes parameters passed, so can then be reviewed further, for example in SSMS.
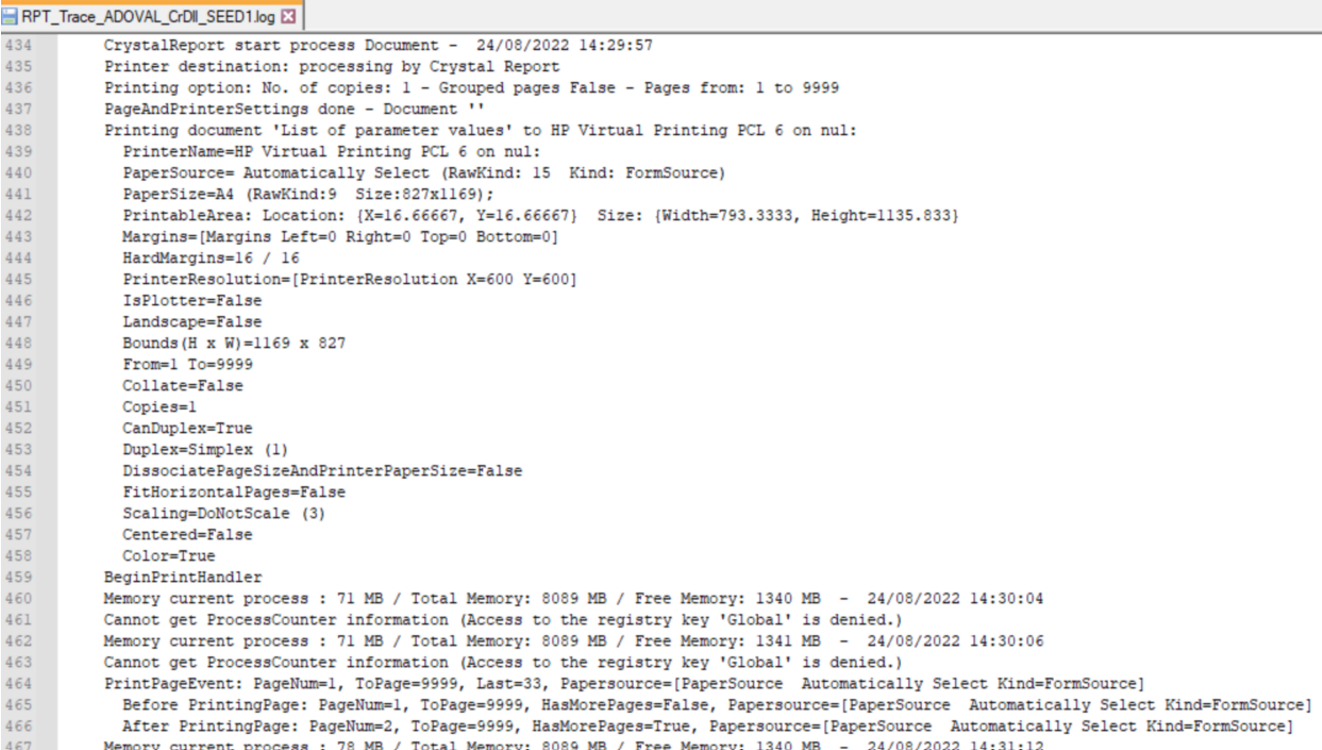
- Printer details
Further down, the settings used to print to the physical printer are listed, which may be useful to understand for issues where the report format is not as expected.
When running in console mode
You can also run the Print Server in Console mode (for diagnostic purposes) The differences are (compared to the service method) you gain a small advantage in that you can see messages in the console window that may otherwise be lost, however it also means you cannot close your Windows session whilst running in console mode, else the print service will also close.
The steps to take for console mode are:
- Stop the current X3 Print Server service, for example "Safe_X3_SrvEdt_V2_EDT_DEFAULT"
- Open a CMD prompt window using the “Run as different user” option. Login as the same Windows account that runs the Print Server service.
- In the CMD window, navigate to the X3 Print Server installation directory. e.g. “cd /d D:\Sage\SafeX3\PrtSrv”
- (Optional) Click the top left of the CMD box and click properties. On the Layout tab, modify the width to 100 and height to 1000 for the Screen Buffer Size
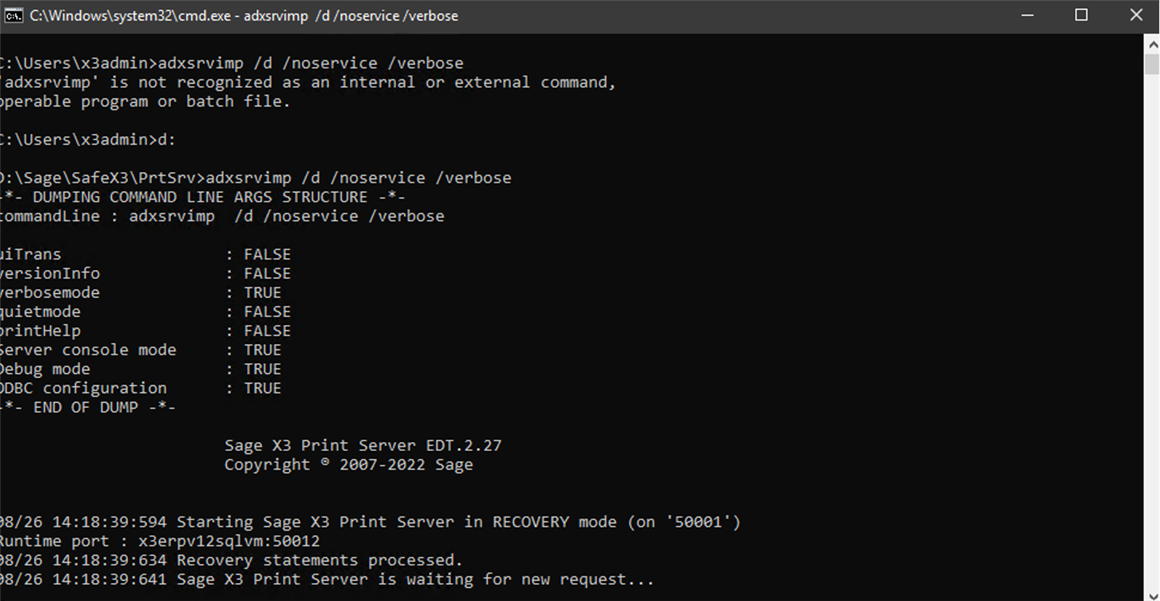
- Execute the command "adxsrvimp /d /noservice /verbose"
- Now the Print Server should be started and you will see message "Sage X3 Edition Server is waiting for new request..."
- Run the report or other steps you are interested in diagnosing
- Once your testing is completed, in the CMD window press Ctrl-C to stop the command and therefore stop the print service as well
- Save and upload all the information displayed into the CMD prompt window. Click the top left of the CMD box, then select Edit, Select All, then right click to copy the contents which you can then paste into a text file, then close the CMD prompt window
- Also review the "AdxSrvImp_Trace.log" and the "RPT_Trace*.log"
- Restart the Print Server service to resume normal operations
Enable Crystal Reports detailed logging
This option is not often used but could be useful when it seems Crystal Reports is causing some issue. The data gathered is very large, and analysis can be difficult or inconclusive, so generally you should only use this technique when directed by Sage Support.
The steps are documented in “Enable logs in SAP VS Studio Crystal Report” section of the “Print Server Presentation and Operation Guide” online help.
Enable the detailed logging when no other users are printing, generate the report you wish to diagnose, then turn off the detailed logging.
The generated log files are located in the "C:\Users\[userId]\AppData\Local\Temp" directory (where [userId] is the user running the Print Server service) and the filename starts with "AdxImpNet" and has .GLF file extension.
4. What Syracuse layer logging is useful
How useful the Syracuse layer information is will depend on where the issue you are trying to find is. If the issue is before the report has reached the Report Server, then it’s more likely the Syracuse layer logging will be useful.
In Administration, Administration, Settings, Global Settings set the following to “info” or “debug” level
--- classic.action
--- http.in
--- x3Comm.client
--- x3Comm.conn (No longer there from V12 p27)
--- x3Comm.dispatcher
--- x3Comm.print
--- x3Comm.runtime (V12 P26+)
NOTE: these changes take effect immediately for ALL users when you save these changes. Ensure you remember to reset these back to the original values once the troubleshooting process for this issue has been completed.
5. Generating a SQL trace
We have already seen that the Report Server debug output gives us the complete SQL for the Crystal Report, so do we need to generate SQL trace any other way? Well, you might not want to or be able to turn on debug mode as it needs Print Server to be restarted – or you might find you get slightly different results when running the same SQL from SSMS rather than the Report Server.
If you wish to generate a SQL trace for the steps within X3, then you can simply follow the normal SQL tracing process, described in KB article "How to generate a SQL trace for one user session"
Generating SQL for one Report Server process (AdxImpNet) it is a bit trickier as we don’t know the PID or Database SessionId prior to the report execution.
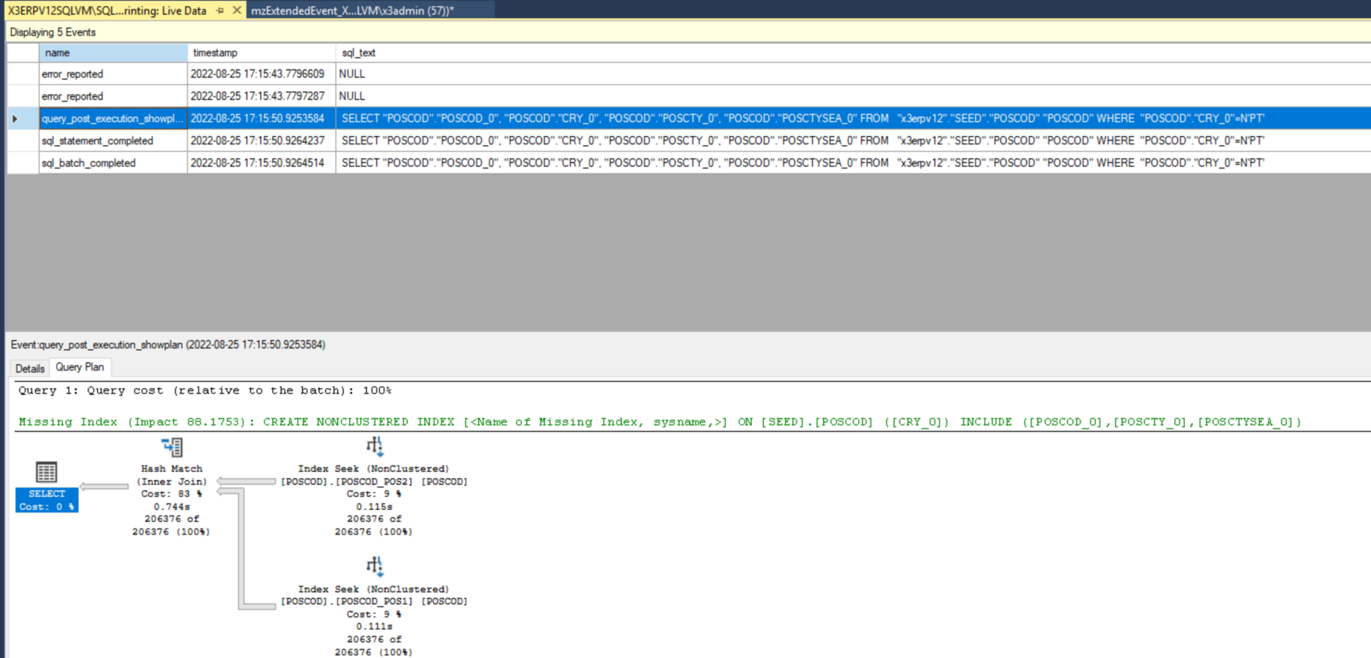
One way to achieve this is to use the Extended Event file “mzExtendedEvent_X3_trace_Printing.sql” which is provided in “InvestigationScripts\SQL\ExtendedEvents” You need to change the folder name, then execute the script to create the extended event definition. When you start the session ALL reports will be traced until you stop it again.
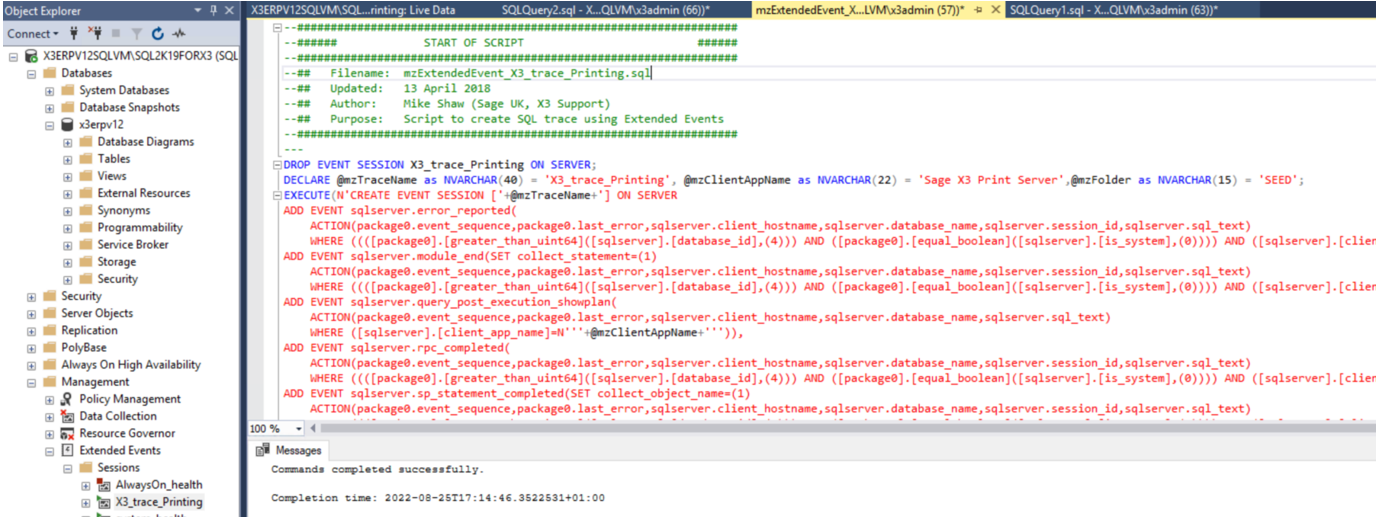
You can watch the SQL generate live, or review the X3_trace_Printing*.xel file (located in the Microsoft SQL Server logs directory)
6. Testing the Print Server database connectivity
The X3 Print Server uses a specific ODBC data source which is generated when you configure the print server via the X3 Console. This 32-bit ODBC data source is owned by the Windows account who is specified in the Windows Service and is named "ADX_<SOLUTIONNAME>" Depending on which version you are using, the ODBC data source may be created as a System DSN rather than a User DSN.
To check the "ADX_<SOLUTIONNAME>" ODBC data source, take the following steps:
Login as the X3 Runtime account being used for the Print Server service
Launch the Windows program "ODBC data sources (32-bit)"
Alternatively you can open a CMD prompt window using the “Run as different user” option and login as the same Windows account that runs the Print Server service. Then run the command “%systemdrive%\Windows\SysWow64\Odbcad32.exe”
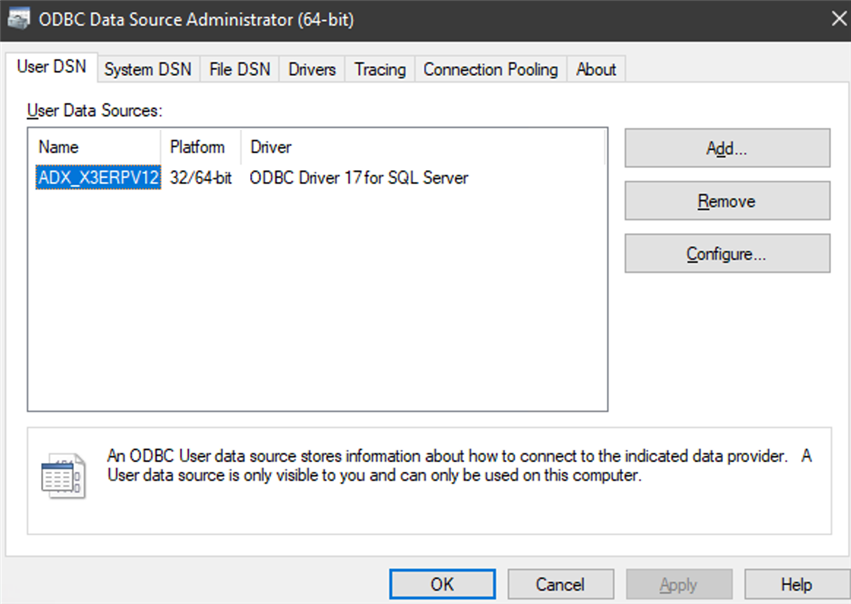
In the "User DNS" tab select the "ADX_<SOLUTIONNAME>" data source and click "Configure". Click "Next" then for the Login ID and password, use X3 and the appropriate folder password.
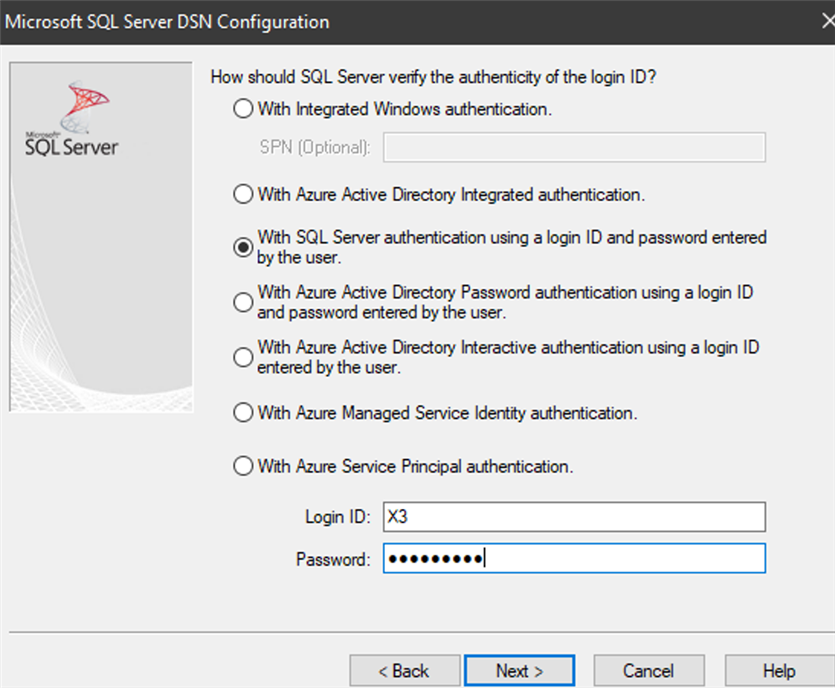
Click "Next" a couple of times, then "Finish" You can then use the "Test Data Source" button to check the connectivity.


To resolve any connectivity issues you can follow KB article "Error: When printing "Unable to connect: incorrect log on parameters""
Further reading
Print Server Presentation and Operation Guide https://online-help.sageerpx3.com/erp/12/wp-static-content/static-pages/en_US/v7dev/getting-started_print-server-presentation-and-operation-guide.html
Conclusion
This article has hopefully highlighted the main tracing and diagnostic options for troubleshooting the Print Server. I would be happy to hear any of your feedback below.