

Sage 50cloud powered by Office 365's new feature:
Sage Dashboard
O365 provides you with a new Sage Dashboard that allows customers to get insights into critical areas of their business using an interactive dashboard.
When you synchronize your Sage 50cloud data with Office 365, key information about your revenue, expenses, receivables, payables; is securely stored in Office 365.
This data can be displayed on an interactive dashboard that you can access anywhere and from any device.
If you've already connected your Sage 50cloud company to Office 365, you're ready to use Sage Dashboard to keep track of your company's key indicators or KPIs.
How to setup the Sage Dashboard
To display Sage Dashboard in Office 365, go to your Office 365 portal. View the top left corner for the Office 365 apps button.
Find Sage Dashboard in your list of apps. Sign into the app to sign into the Sage Dashboard.
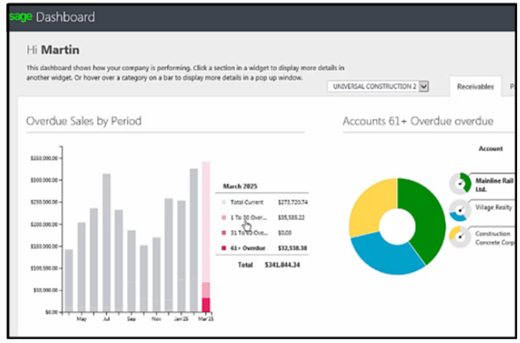
The Dashboard includes 3 tabs, Receivables, Payables and Revenue and Expenses.
How to drill down into the Accounts Receivable tab
The gif image below, selects the latest period, it shows a breakdown of sales by aging period, in our case we looked at our sales in the 1 to 30 Overdue period; which displays a graph (on the right side) which displays the account, their credit limit, their balance in the aging period selected, and their current balance.
For more information about one specific client you can even drill down further by clicking on the client's name to display individual transactions including invoices and deposits. For each transaction, you can see the original amount and the outstanding amount.
View this Sage University resource for more content and detail about the Payables and a Revenue & Expenses tab with interactive graphs.
Setup O365 with Sage 50cloud
We have a dedicated team available to support this 0365 integration with our Sage 50cloud product line available at 1-888-522-2722 option 6 or by email at: [email protected] provide your:
- Account ID with Sage
- Contact info: email and phone number