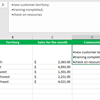
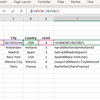
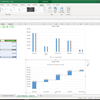
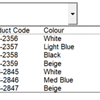
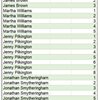
Sage City Community
Sage City Community
  • User
  • Site
  • Search
  • User

Blogs
Blogs
Excel Tips & Tricks
  • More
  • Cancel
  • Subscribe by email
  • More
  • Cancel
  • Tags
  • Subscribe by email
  • More
  • Cancel
  • Discover a more detailed analysis of dates using timelines in Excel

    David Bryant
    David Bryant
    Have you ever felt the need to effortlessly switch the date ranges within your Pivot Table in Excel? Have you ever wanted to view the data for just one specific time-frame without having to apply a logical filter all the time? When is the last time y...
    • 20 Jun 2018
  • Learn how to select your data conveniently using keyboard shortcuts

    Peter Scully
    Peter Scully
    In a previous tip, we showed you how you can navigate around a data list quickly using keyboard shortcuts.   To view the tip, take a look here.   By combining the same shortcuts with the Shift key, you can easily make selections in your dat...
    • 12 Jun 2018
  • How to calculate the average of the top 5 values

    Glynnis
    Glynnis
    Let's say you have a workbook containing sales over a two year period. You would now like to know what the average is for your top 5 sales values, as well as the value for your largest sale. In our example, which you are welcome to download here, we...
    • 4 Jun 2018
  • How to reduce the size of a workbook using a single formula

    Sage Business Intelligence Blog team
    Sage Business Intelligence Blog team
    Sometimes, large Microsoft Excel workbooks can be slow and inefficient—which could cause frustration.   To reduce the size of a workbook, consider replacing several formulas with a single array formula. Array formulas can perform mult...
    • 30 May 2018
  • How to create a Hierarchy SmartArt Graphic in Excel

    Sage Business Intelligence Blog team
    Sage Business Intelligence Blog team
    Microsoft Excel offers you the ability to create and design a Hierarchy SmartArt Graphic.   This is useful in showing a graphical representation of an organogram, organisation chart or any hierarchy structure. This example, explained below, wil...
    • 23 May 2018
  • How to create more accurate forecasts with Excel

    Ruthie
    Ruthie
    Do you need to future-proof your business? The Excel Forecast sheet may be the right tool for you! The Forecast sheet allows you to take your historical business data (sales, cash flow, etc.) and create more accurate forecasts for the future. You ar...
    • 8 May 2018
  • Inserting 3D models into an Excel spreadsheet

    nigelnaicker
    nigelnaicker
    This is a tip that you're going to really enjoy if you love imagery and visualisations in your spreadsheet! It's not the most useful tip in the world, but for most people, especially the creative types—it will put a smile on your face because it's so...
    • 2 May 2018
  • Learn how to navigate through your data quickly with keyboard shortcuts in Excel

    Peter Scully
    Peter Scully
    When working with large data lists in Excel, you may need to know the extent of the data, i.e. the number of rows and columns.   If consistency of the data is important too, then you may need to identify whether there's any empty rows, columns o...
    • 24 Apr 2018
  • Learn how to extract more than one column of data with a single VLOOKUP formula in Excel

    Edwin C
    Edwin C
    It's been well over 10 years since I started training Microsoft  Excel  to corporate clients. During training sessions, delegates would usually ask questions on how they can use Excel to help them become more effective in their wo...
    • 18 Apr 2018
  • How to use a slicer instead of a drop-down list in Excel

    Sage Business Intelligence Blog team
    Sage Business Intelligence Blog team
    Selecting data from a drop-down list is a convenient and accurate way of entering data into a range. It helps in ensuring that the correct data is entered quickly in Microsoft  Excel. However, a slicer provides a quicker, better and easier way o...
    • 11 Apr 2018
  • How to calculate the average useful life of assets

    Sage Business Intelligence Blog team
    Sage Business Intelligence Blog team
    To complete an analytical review of the depreciation of your company's assets, you can calculate the average useful life of these assets. The average useful life, which is a measure of conditional central tendency, can be calculated using the AVERAGE...
    • 4 Apr 2018
  • How to effectively use custom number formatting to display your + or - values

    Sage Business Intelligence Blog team
    Sage Business Intelligence Blog team
    In order to effectively analyze data, custom number formatting can be applied to your Microsoft  Excel  spreadsheet. Custom number formatting is used to easily identify values based on a set criteria. In a large Excel spreadsheet, you can e...
    • 29 Mar 2018
  • 3 Easy steps to hide zero values in Excel

    Edwin C
    Edwin C
    To have neat looking reports in Microsoft Excel, you may decide that you want to hide zero values. In this tip, we explain how to hide zero values for selected cells by using the custom number format. The hidden zero values appear in the formula bar ...
    • 22 Mar 2018
  • How to compare and merge a shared workbook in Excel

    Sage Business Intelligence Blog team
    Sage Business Intelligence Blog team
    Sometimes when working in Excel and collaborating with your colleagues on a single document, you may wonder to yourself; how can I compare and merge a shared workbook? The answer is simple! You can do this by using the Compare and Merge Workbooks com...
    • 14 Mar 2018
  • 3 Easy steps to help you complete a cash flow template

    Edwin C
    Edwin C
    In order to correctly show the movement and management of cash within a business, accountants use a cash flow statement. This statement will display a business's money coming in from'cash receipts' and where it has paid money out,'cash paid'. The cas...
    • 7 Mar 2018
  • Learn how to forecast with scenarios using what-if analysis tools in Excel

    Edwin C
    Edwin C
    The Scenario Manager is a feature in what-if analysis and you can use this to enhance your forecasting in Microsoft  Excel  . A scenario is a set of values that Excel saves and can automatically substitute in specific cells on a worksheet...
    • 27 Feb 2018
  • Quickly split data into two or more columns in Excel

    Sage Business Intelligence Blog team
    Sage Business Intelligence Blog team
    If you ever need to split data from one column in your Microsoft  Excel  worksheet into two or more columns, you can use the LEFT, MID and RIGHT Text functions. The LEFT function returns the first character or characters in a text string...
    • 20 Feb 2018
  • Using conditional formatting with custom Excel formulas

    Edwin C
    Edwin C
    Conditional formatting is an effective Microsoft Excel feature that allows you to highlight important information, for example; the ability to find duplicate values within your spreadsheet. You can create your own rule by applying conditional formatt...
    • 13 Feb 2018
  • How to calculate Sales Tax/ VAT using PowerPivot Measures in Excel

    Edwin C
    Edwin C
    In a  previous  tip, we showed you how to set up a PivotTable using PowerPivot. You're now going to learn how you can easily calculate Sales Tax/ VAT using the Measures feature in the PowerPivot tab. If you're the business's accountant, you...
    • 6 Feb 2018
  • How to determine whether you are over or under budget using custom formats

    Edwin C
    Edwin C
    Monitoring budgets can be quite stressful and may often involve the use of formulas. Instead of complicated formulas, you can use custom formats within Microsoft Excel to easily determine if you are over or under budget. All it takes are a few steps...
    • 24 Jan 2018
  • How to create a hyperlink to a specific location in a workbook

    Edwin C
    Edwin C
    For quick access to related information in another file, workbook or on a web page, you can insert a hyperlink in a Microsoft  Excel  worksheet cell. You can also insert hyperlinks in specific chart elements or images. If you struggle to...
    • 28 Nov 2017
  • How to view or compare two or more worksheets at the same time in Excel

    Edwin C
    Edwin C
    You can quickly view or compare two or more worksheets in the same workbook, or in different workbooks, by viewing them side by side. You can also arrange multiple worksheets to view them all at the same time. In this tip, I show you how. Applies ...
    • 14 Nov 2017
  • Collaborating on a Shared Workbook

    Edwin C
    Edwin C
    Multiple users can effectively work on a spreadsheet by sharing it, and then collaborating on it. Edits can be made simultaneously by team members, thus having a continuously updated version of the spreadsheet available all the time. In this way, ver...
    • 7 Nov 2017
  • Discover how to compare two versions of a workbook in Excel

    Edwin C
    Edwin C
    Sometimes when working in Excel, you may want to compare two versions of a workbook to see what was changed. It could be an issue such as totals that are manually entered instead of formula calculated that you want to check. You can use Microsoft ...
    • 25 Oct 2017
  • How to work with numbers containing more than 15 digits in Excel

    Glynnis
    Glynnis
    Numbers containing more than 15 digits in Excel are not often used, however some users might use them when recording credit card numbers, account numbers, stock codes, etc. Applies To: Microsoft  Excel  for Windows 2013 and 2016. Excel ...
    • 20 Sep 2017
<>
  • facebook
  • instagram
  • linkedin
  • twitter
  • youtube
  • Sage logo
  • © Sage Group plc 2020
  • Privacy and cookies
  • Community guidelines
  • GDPR
  • Accessibility