Excel 2016.
- On the Insert tab, in the Tours group, click 3D Map, and then select Open 3D Maps.

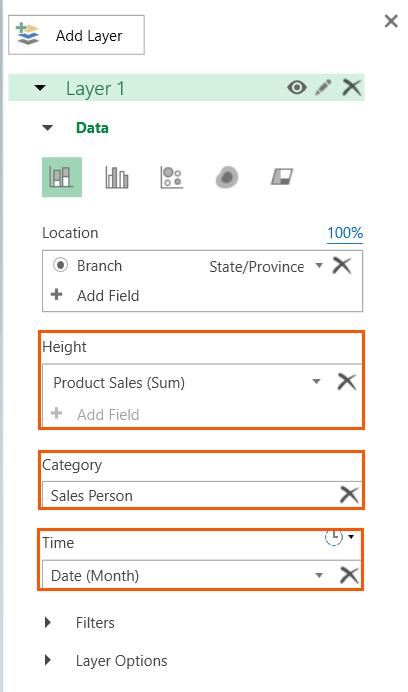
- Drag fields from the Field List into the appropriate lists in the Data tab. Place the values by which you want to visualize your data in the Height list, fields by which you want to categorize your data in the Category list, and, if you want to see your data animated over time, place the time or date field in the Time list.
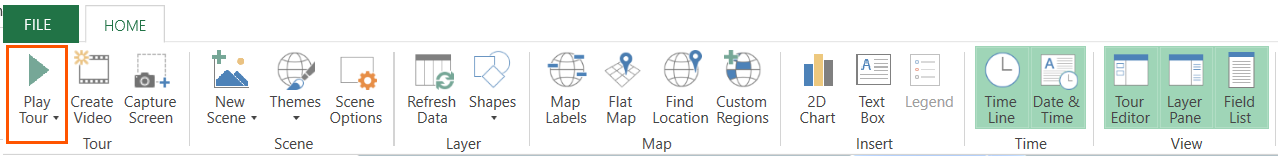
- On the Home tab, in the Tour group, click Play Tour.
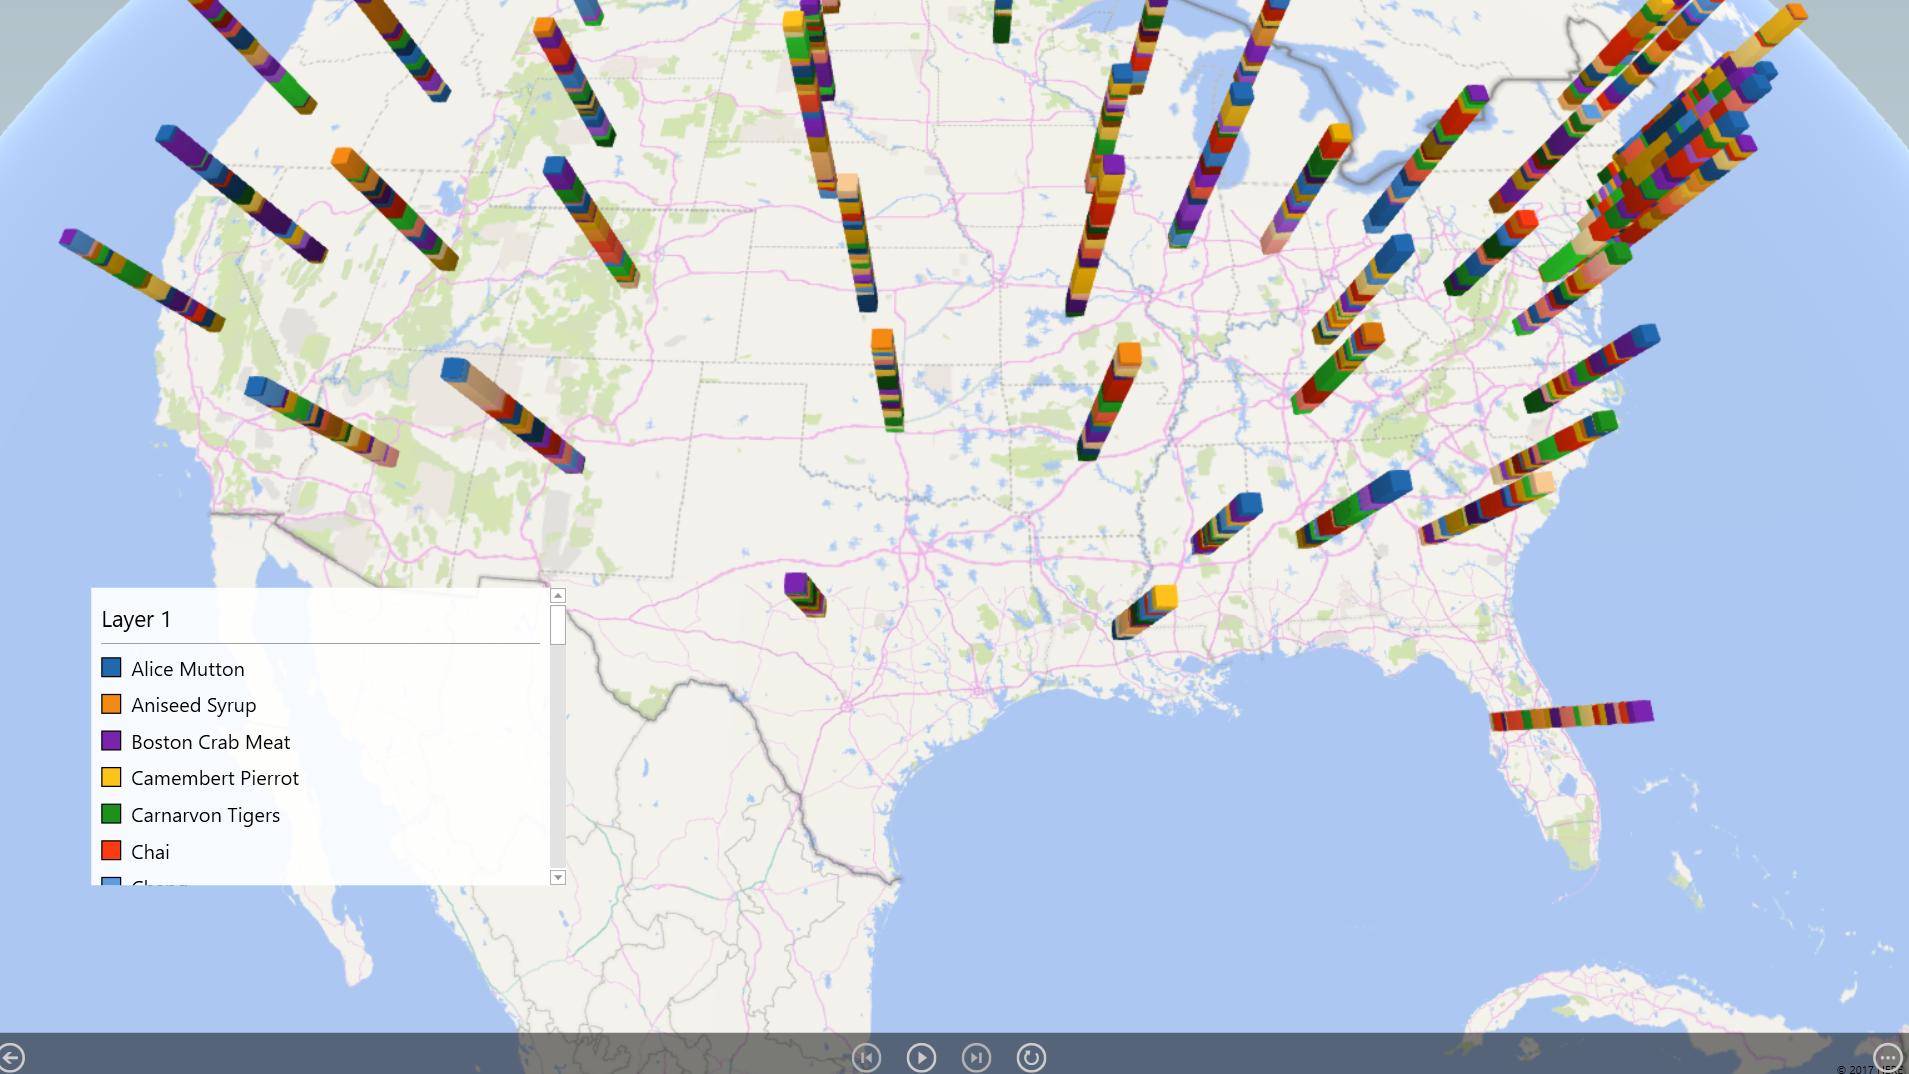
When you click the Play Tour button, 3D Map automatically hides the Tour Editor and Layer panes along with the Time Line control and plays the animation. When you're finished watching the animation, return to the regular editing view by clicking Go Back to Edit View. Click the Close button in the far-right corner of the 3D Map title bar to close it and return to your Excel worksheet.